Ripple
XRP short sellers dominate: Will the altcoin fall to bears?
Short position traders have taken over XRP, but the altcoin could be liquidated if the price continues to rebound.
- The XRP volume saw a slight increase in the past 24 hours.
- Of late, there has been a battle between sellers and buyers.
The rough start to the week for Ripple [XRP] has led to a noticeable shift in market sentiment, with more traders now opting to take short positions against XRP.
This change was reflected in one of XRP’s key derivative indicators, which suggests an increase in bearish sentiment among traders.
XRP sees a change in mood
AMBCrypto’s analysis of Ripple’s Funding Rate on Coinglass reflected a significant shift in market dynamics.
The Weighted Funding Rate for XRP, which was approximately 0.0097% on the 7th of July, underwent a notable decline, dropping below zero by the end of the day, settling into -0.0046% at press time.
This shift from a positive to a negative Funding Rate indicated a transition from buyer to seller dominance.
In essence, a negative Funding Rate suggested that short sellers were willing to pay a premium to maintain their positions. Thus, they expect that the price of XRP will continue to decline.
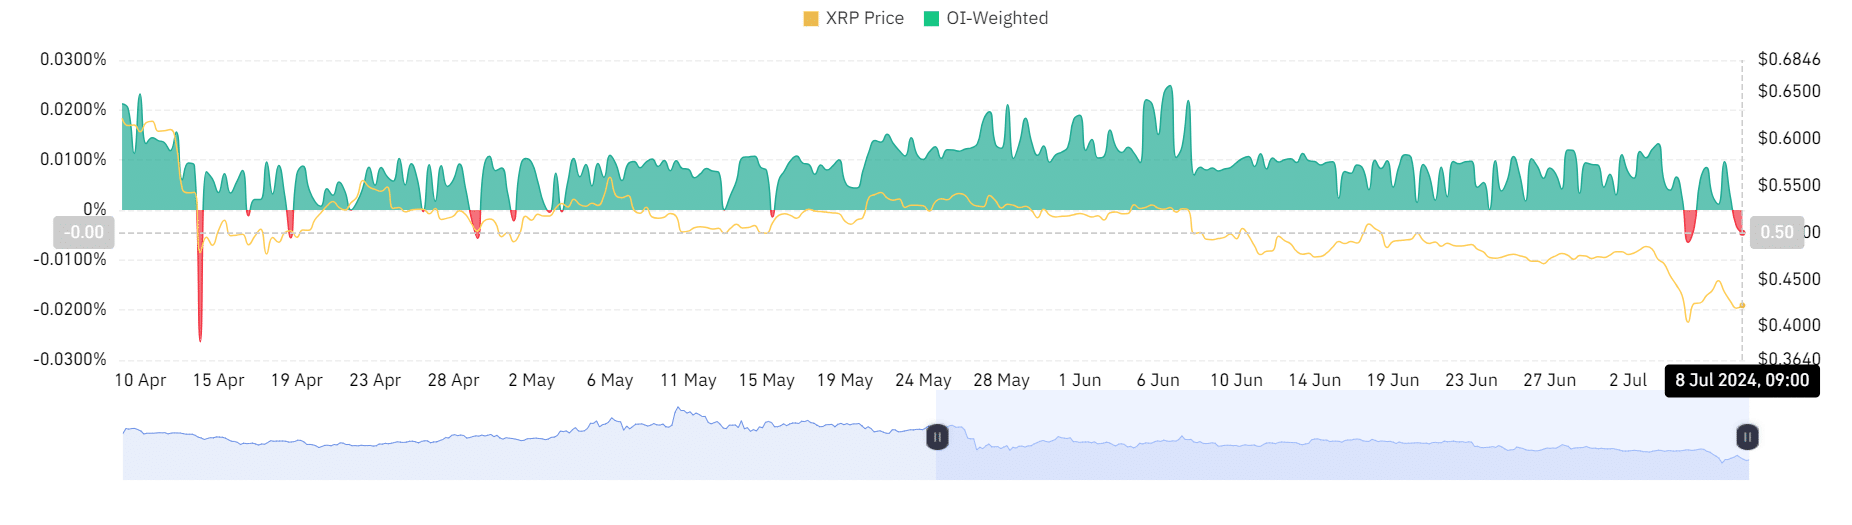
Source: Coinglass
Also, this trend of increasing short positions indicated that trader sentiment had turned bearish on XRP. It also showed that more traders were betting against its short-term price recovery.
Is a recovery in progress?
AMBCrypto’s look at XRP on a daily time frame chart provided insight into why many traders have taken short positions against the asset.
XRP began the week on a downward trend, culminating in a significant drop. The chart showed a drop of 6.65% by the end of trading on the 7th of July, with the price falling to around $0.41.
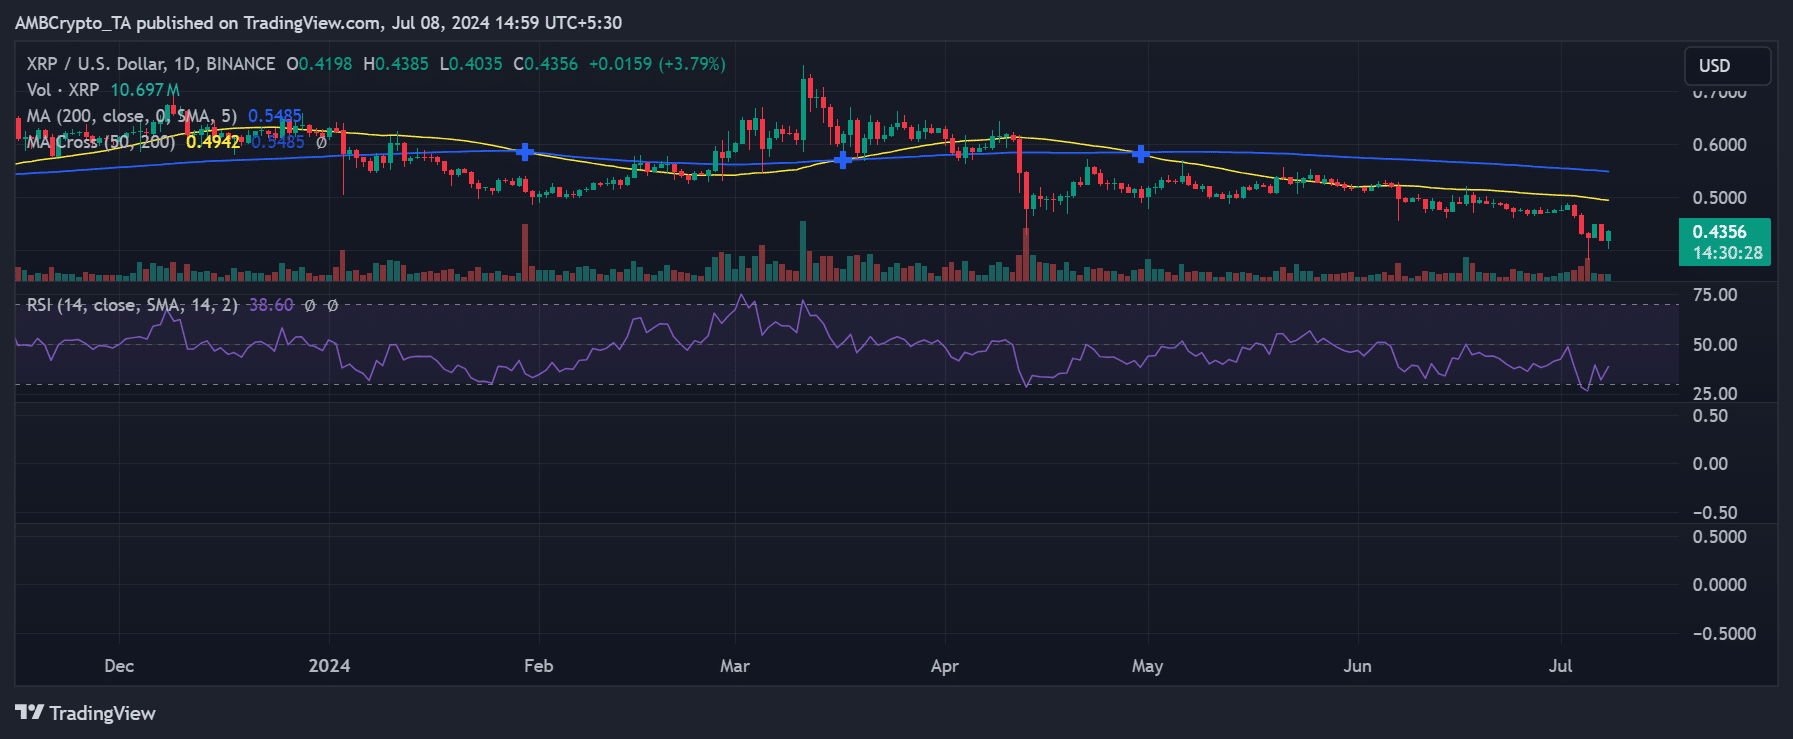
Source: TradingView
At the time of this writing, XRP has shown some recovery, trading at approximately $0.43, representing an increase of over 3%.
This rebound raised questions about the sustainability of the recent price increase. Given the volatility and the recent trend toward short selling, traders and investors may be cautious.
XRP stuck in a bear trend
XRP, on the daily time frame chart, further underscored the asset’s presence in a strong bearish trend. This is highlighted by the Relative Strength Index (RSI).
At press time, XRP’s RSI was below 40, indicating bearish momentum, suggesting the asset might be under significant selling pressure.
Additionally, the chart’s moving averages — often represented as yellow and blue lines — were trending above the press time price.
Realistic or not, here’s XRP market cap in BTC’s terms
This configuration usually signals a bearish market condition, where the moving averages act as resistance levels that can hinder any potential price recovery.
The positioning of these averages above the price reinforces the notion that the downward trend is strong.


