XRP continues to reside in bearish territory
XRP, the third-largest coin by market cap was valued at $0.2599 with a positive 1.20% surge in price in the last 24-hours. At the time of writing, XRP had a market cap of $11.17 billion and the 24-hour volume was noted at $1.08 billion. Most of the trading volume came from RightBTC exchange via trading pair XRP/USDT.
1-hour chart
The one-hour XRP chart indicated a sharp downtrend from $0.2803 which extended to $0.2609.The chart showed a resistance line, which stood at $0.2714 and a support line at $0.2533.

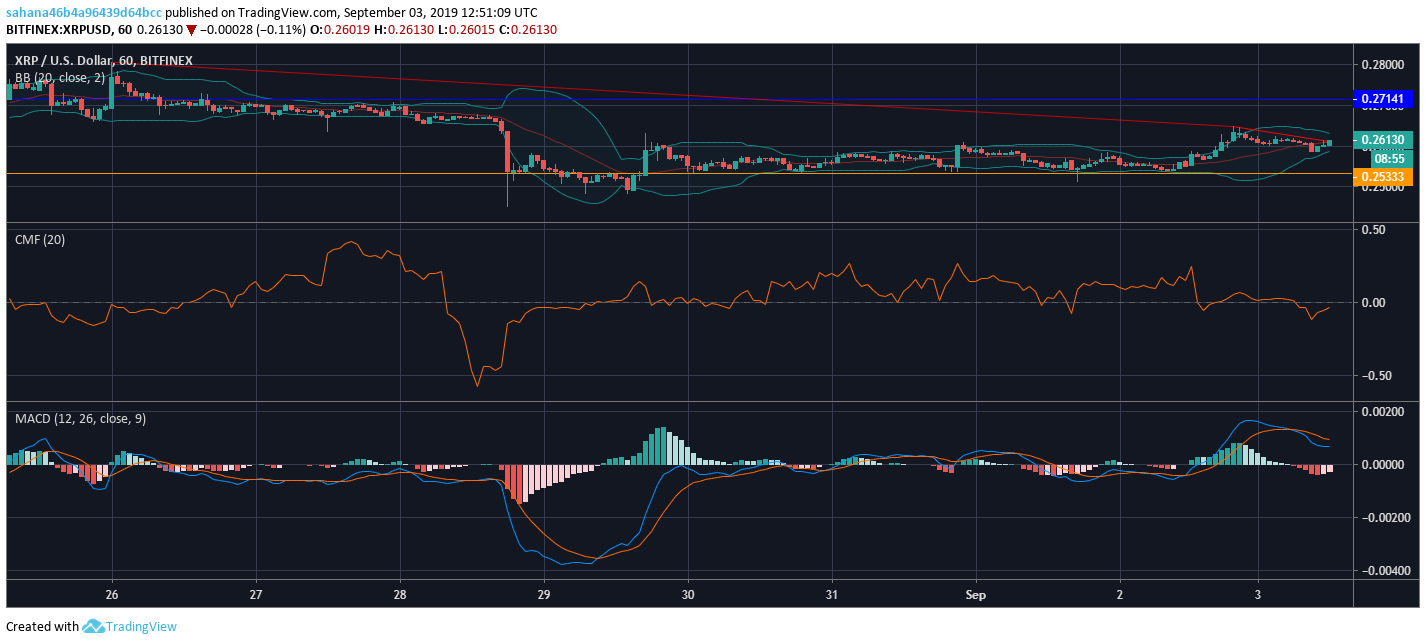
Source: Trading View
The Bollinger Bands are seen close to each other, signaling decreased volatility.
Chaikin Money Flow pointer demonstrated that the capital flowing into the market is lesser than the capital flowing out of the market, as the marker remained below the zero-line.
MACD displayed a bearish crossover as the MACD line is seen below the signal line.
1-day chart
The one-day chart of XRP recorded a sharp downtrend, from $0.5079 to $ 0.2634. The chart displayed resistance at $0.4321 and $0.3297 along with support at $0.2534.
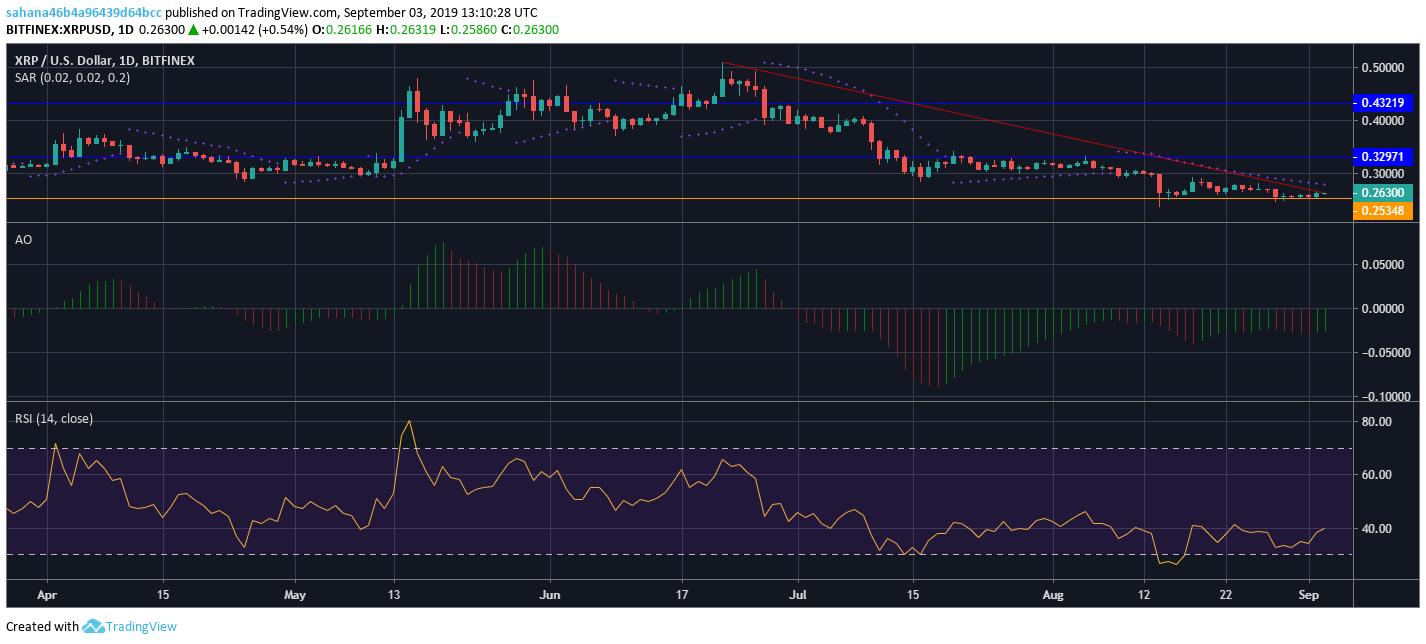
Source: Trading View
Parabolic SAR conveyed a bearish market as the markers are seen above the candles.
Awesome Oscillator pictured the appearance of green bars and the bullish momentum was evident.
The Relative Strength Index indicated that XRP was recovering from being oversold.
Conclusion
The one-hour chart and the one-day chart for XRP both indicated a bearish onslaught as confirmed by the above-mentioned indicators.


