
- BTC losses compounded negative sentiment on crypto bull run prospects
- Despite the drawdown, analysts suggested that the market hasn’t topped.
Bitcoin [BTC] posted more losses on Monday, 25th June, sliding to $58.6K during the intra-day trading session as market sentiment dropped.
The de-risking was also evident across US spot BTC ETFs, which recorded the 7th day of outflows totaling $174.45 million on Monday.
The negative sentiment has worsened with the pending BTC supply overhang from Mt. Gox, German authorities, and BTC miners.
On Monday’s sell-off, over 57K BTC, or $3.4 billion worth of the king coin, was dumped. This begs the question: Is the crypto bull run over?
Is the crypto bull run over?
As the market leader, BTC’s movement gauges the pace and state of the crypto bull run.
Interestingly, historical evaluation of its RSI (Relative Strength Index) suggested more room for a bull run. RSI tracks buying and selling strength in the market.
Per X (formerly Twitter) user and analyst TechDev_52, the RSI channel, which has accurately flashed the market top and bottom, was yet to flash a top as of this writing.
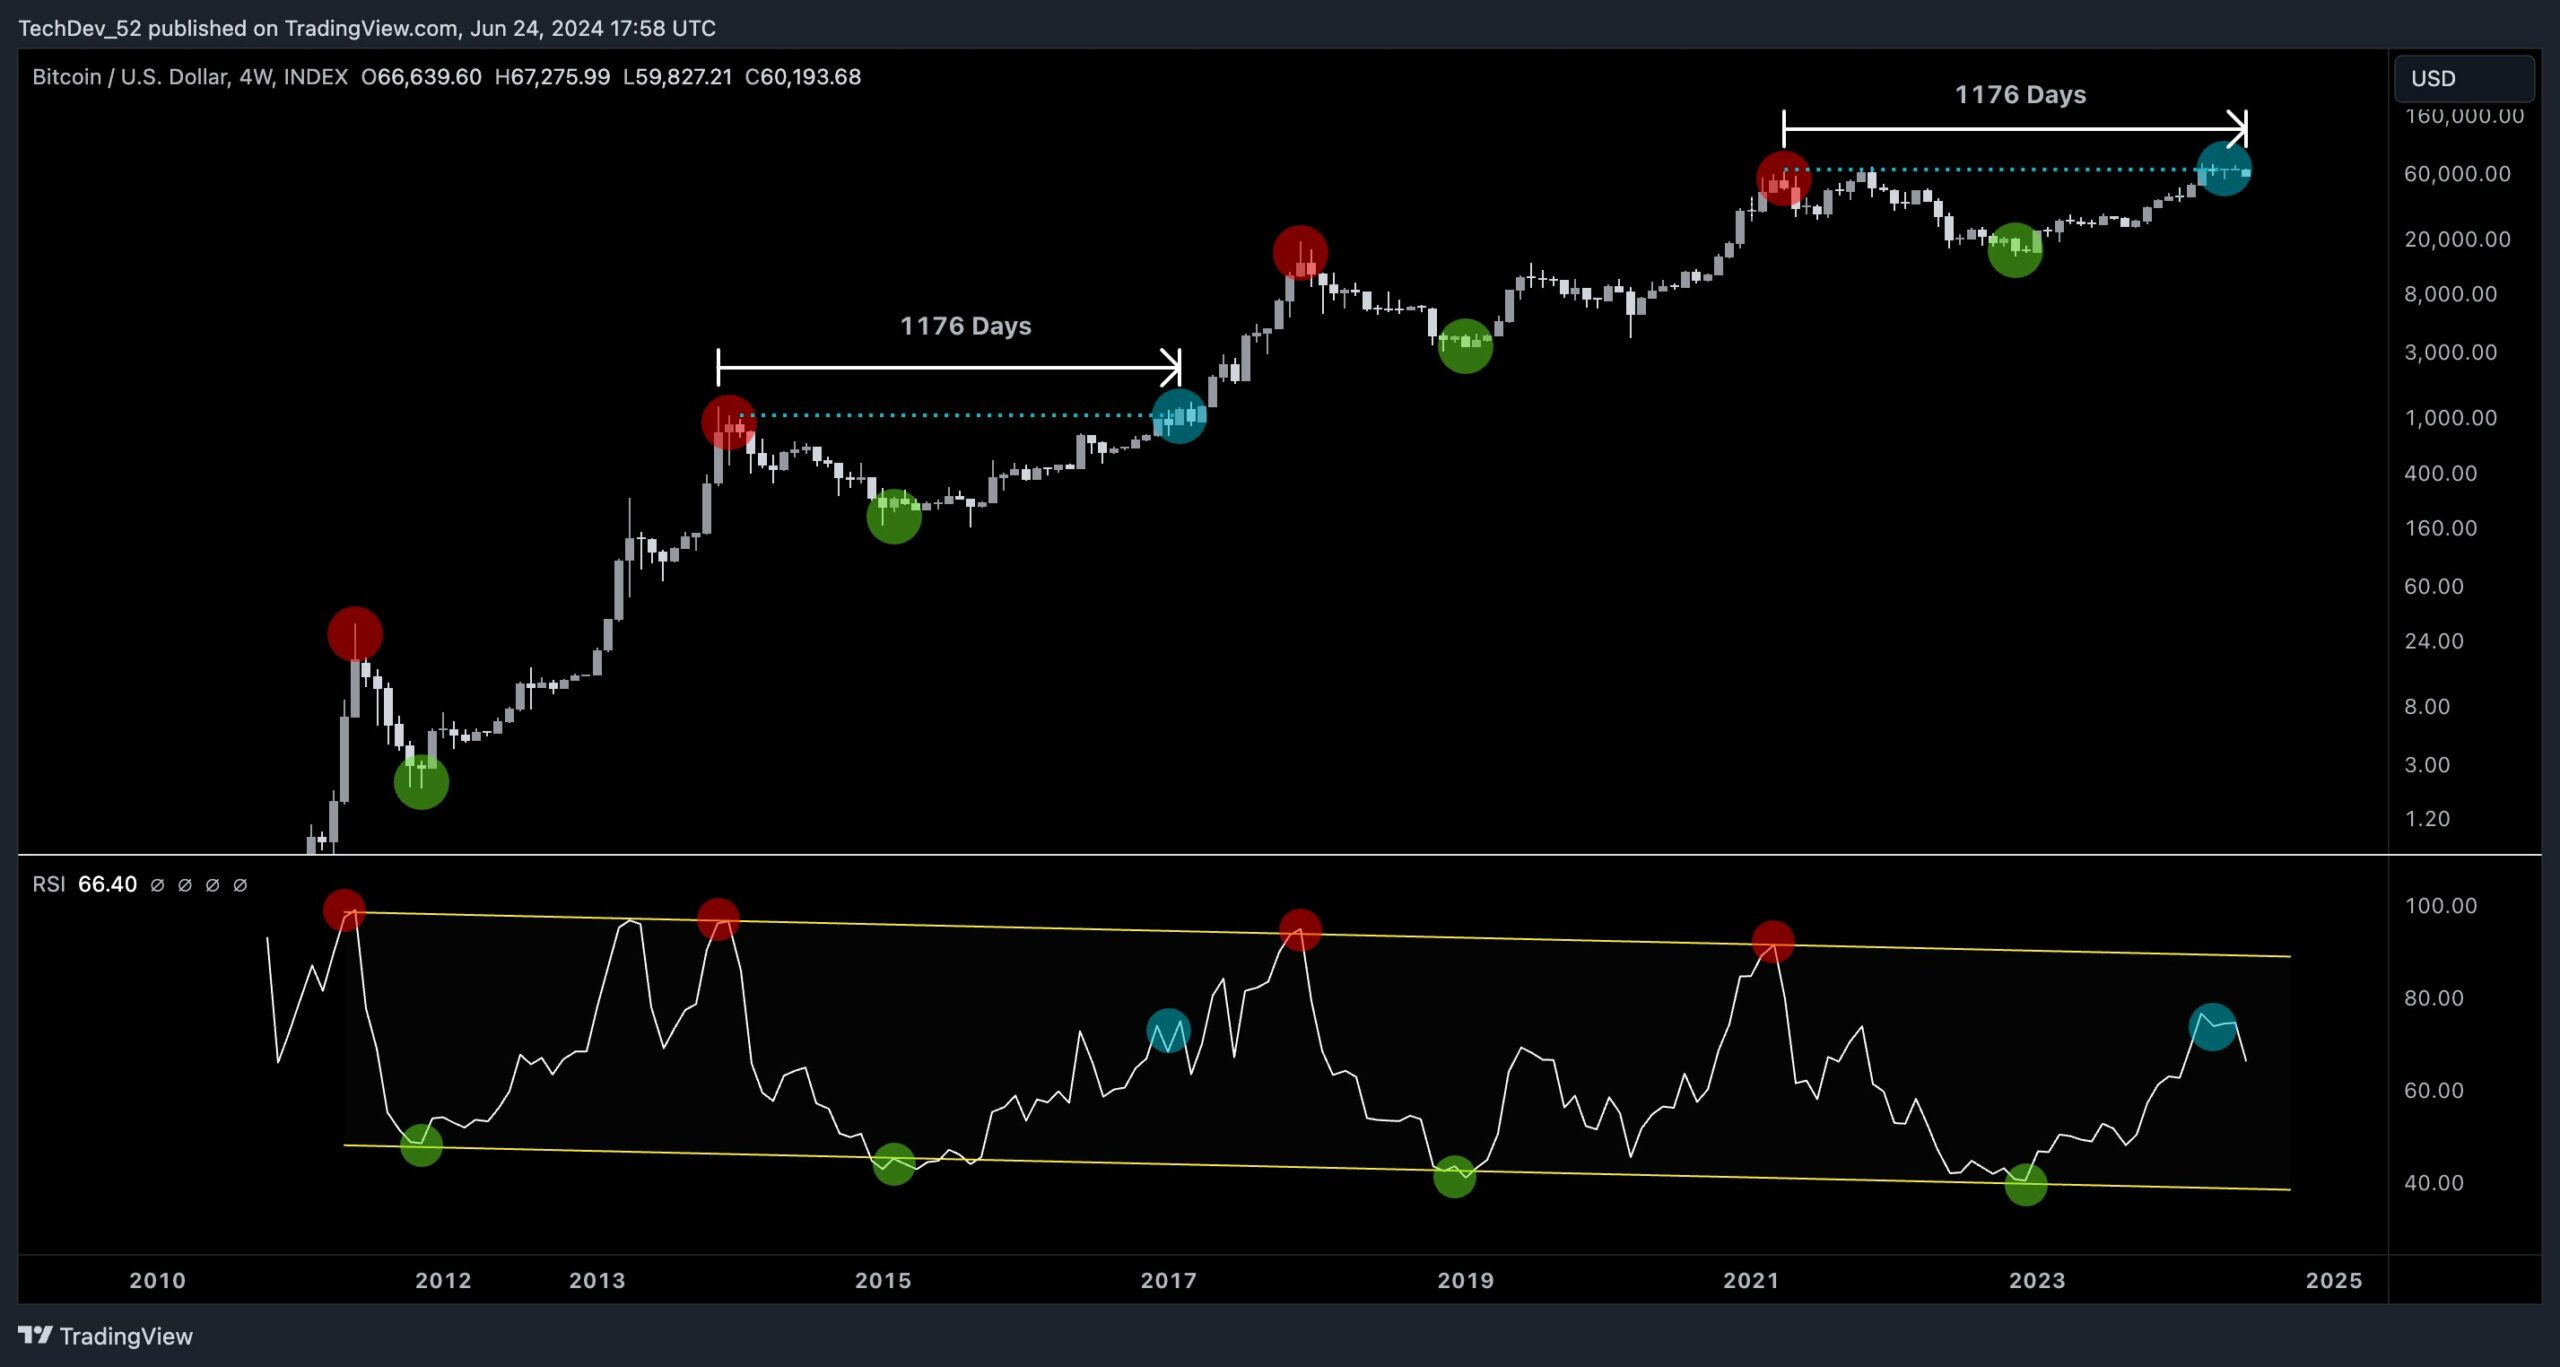
Source: X/TechDev_52
From the chart, a retest of the RSI channel marked the bottom of the market, while a surge to the top range corresponded with the market’s top.
Still on the price charts, another market cycle analyst, Rekt Capital, also downplayed the recent BTC retracement fears. He noted that,
‘The average retrace depth is -22%. The average retrace length is 42 days. This current pullback is -16% deep and 35 days long. This current retrace is not even an average one in depth nor length yet’
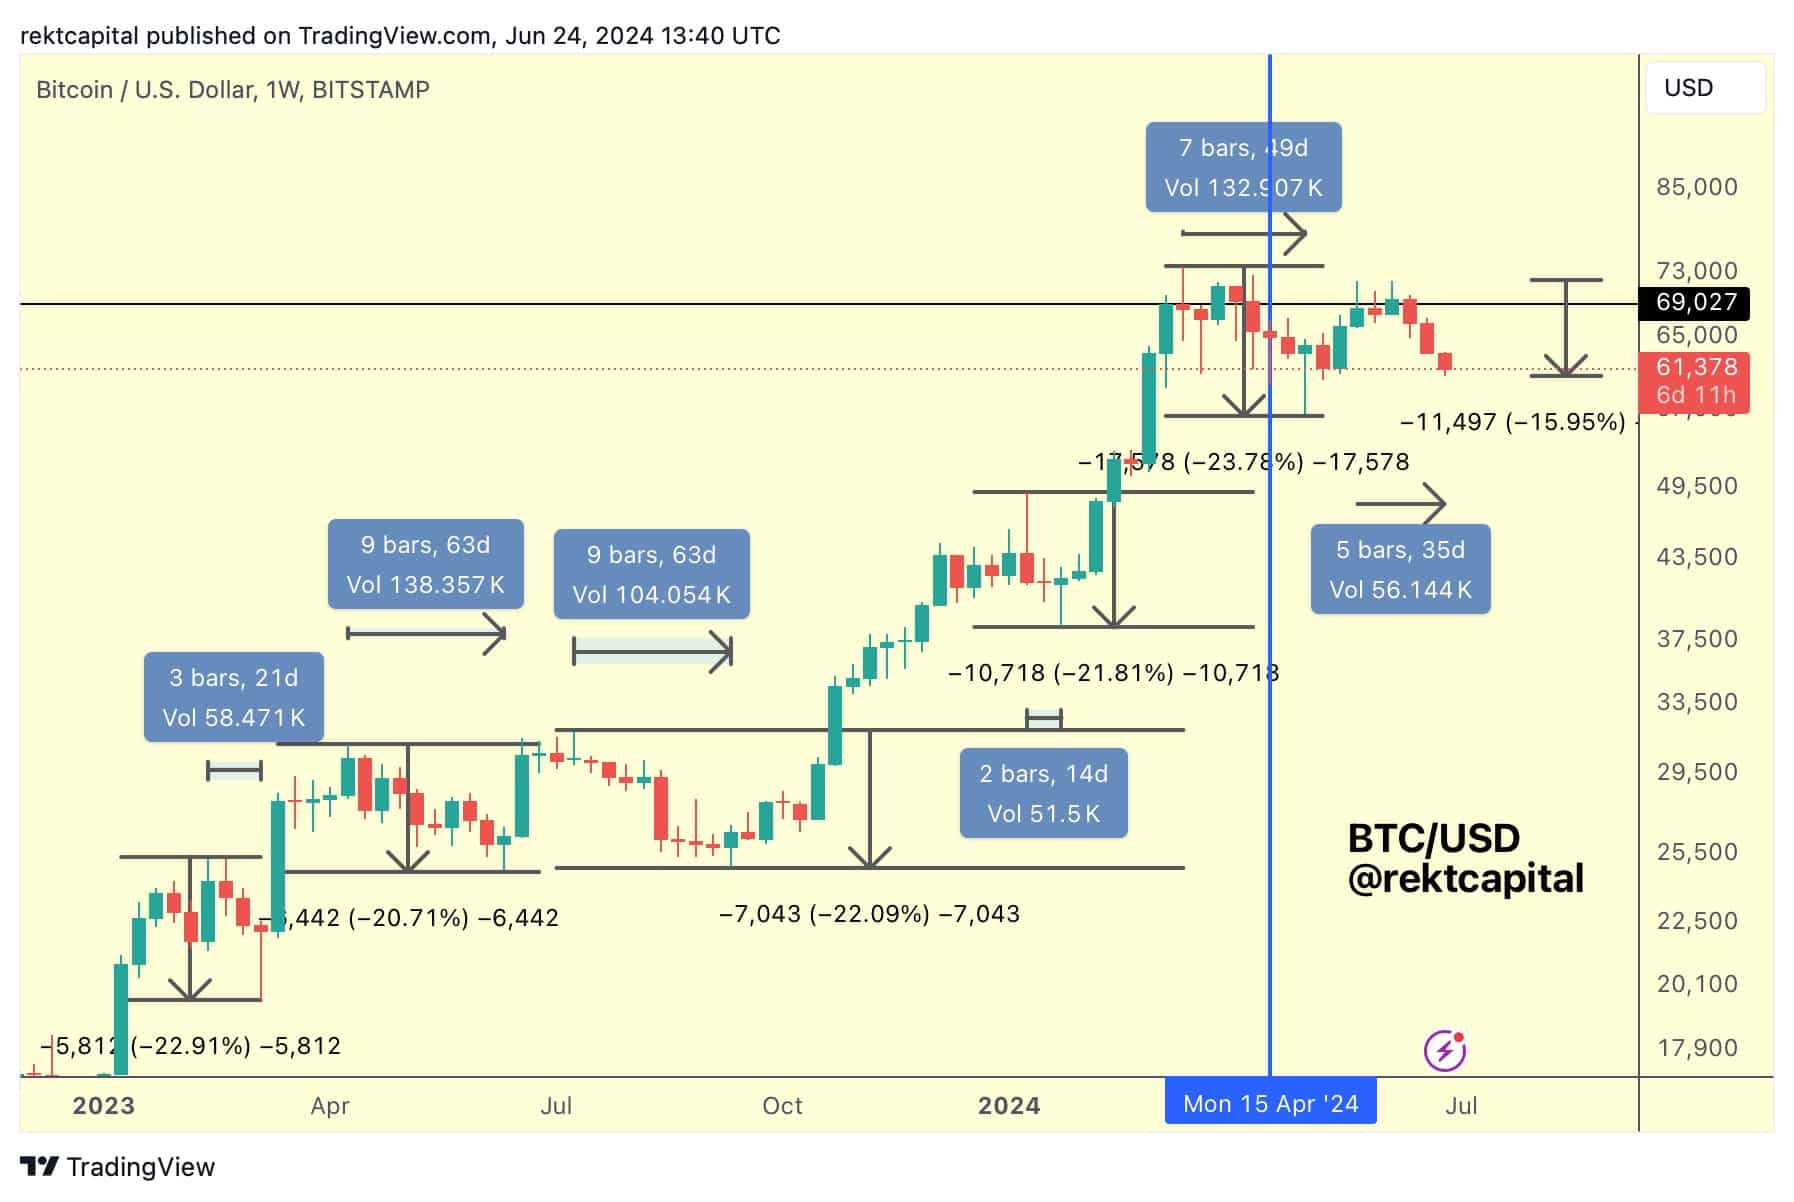
Source: X/Rekt Capital
Another on-chain data point also suggested the crypto bull run wasn’t over yet.
The Market Value to Realized Value (MVRV) Z score, which gauges the BTC market top and bottom from a long-term perspective, was also yet to flash a top signal.
Typical, the market top followed after the metric hit the value above 6 (marked red) or the trending resistance.
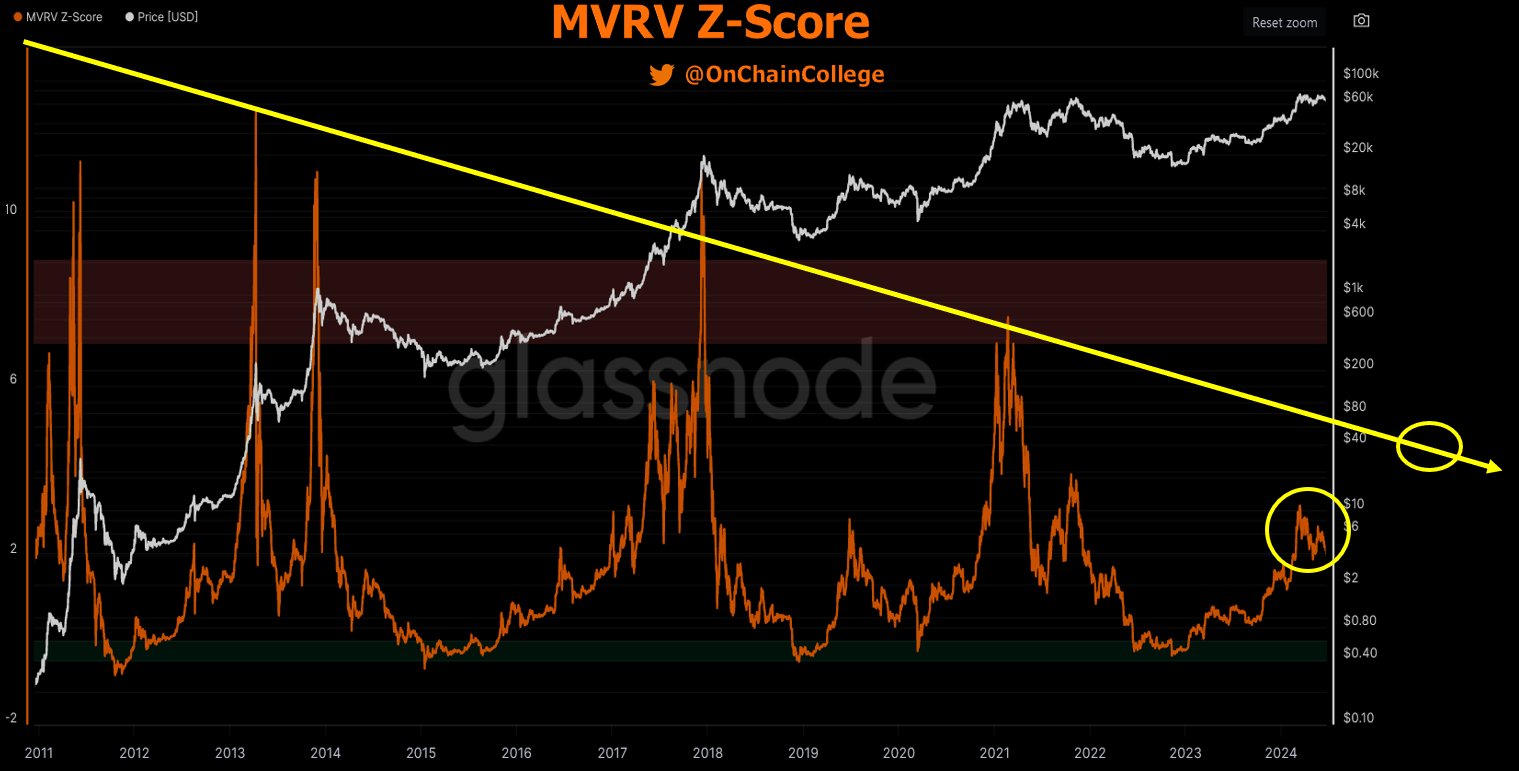
Source: Glassnode
That said, the short-term BTC headwinds from the supply overhang linked to Mt. Gox and others could delay a strong uptrend. However, the long-term projection suggested more room for the crypto bull run to extend.