
- Bulls re-entered near the 200-day EMA as SOL reached an important price point on charts.
- SOL’s funding rate declined but showed signs of improvement.
Solana’s [SOL] reversal from the $202 resistance mark in April set the foundation for the bears’ re-entry into the market. SOL has witnessed strong bearish pressure as it fell toward its 200-day EMA at the time of writing.
As anticipated in our previous SOL article, SOL’s extremely oversold conditions led to a short-term trend reversal on its charts.
The token has once again found itself near a crucial price level, but the readings aren’t fully oversold currently. At press time, SOL traded at around $141.
Can SOL buyers reclaim their edge?
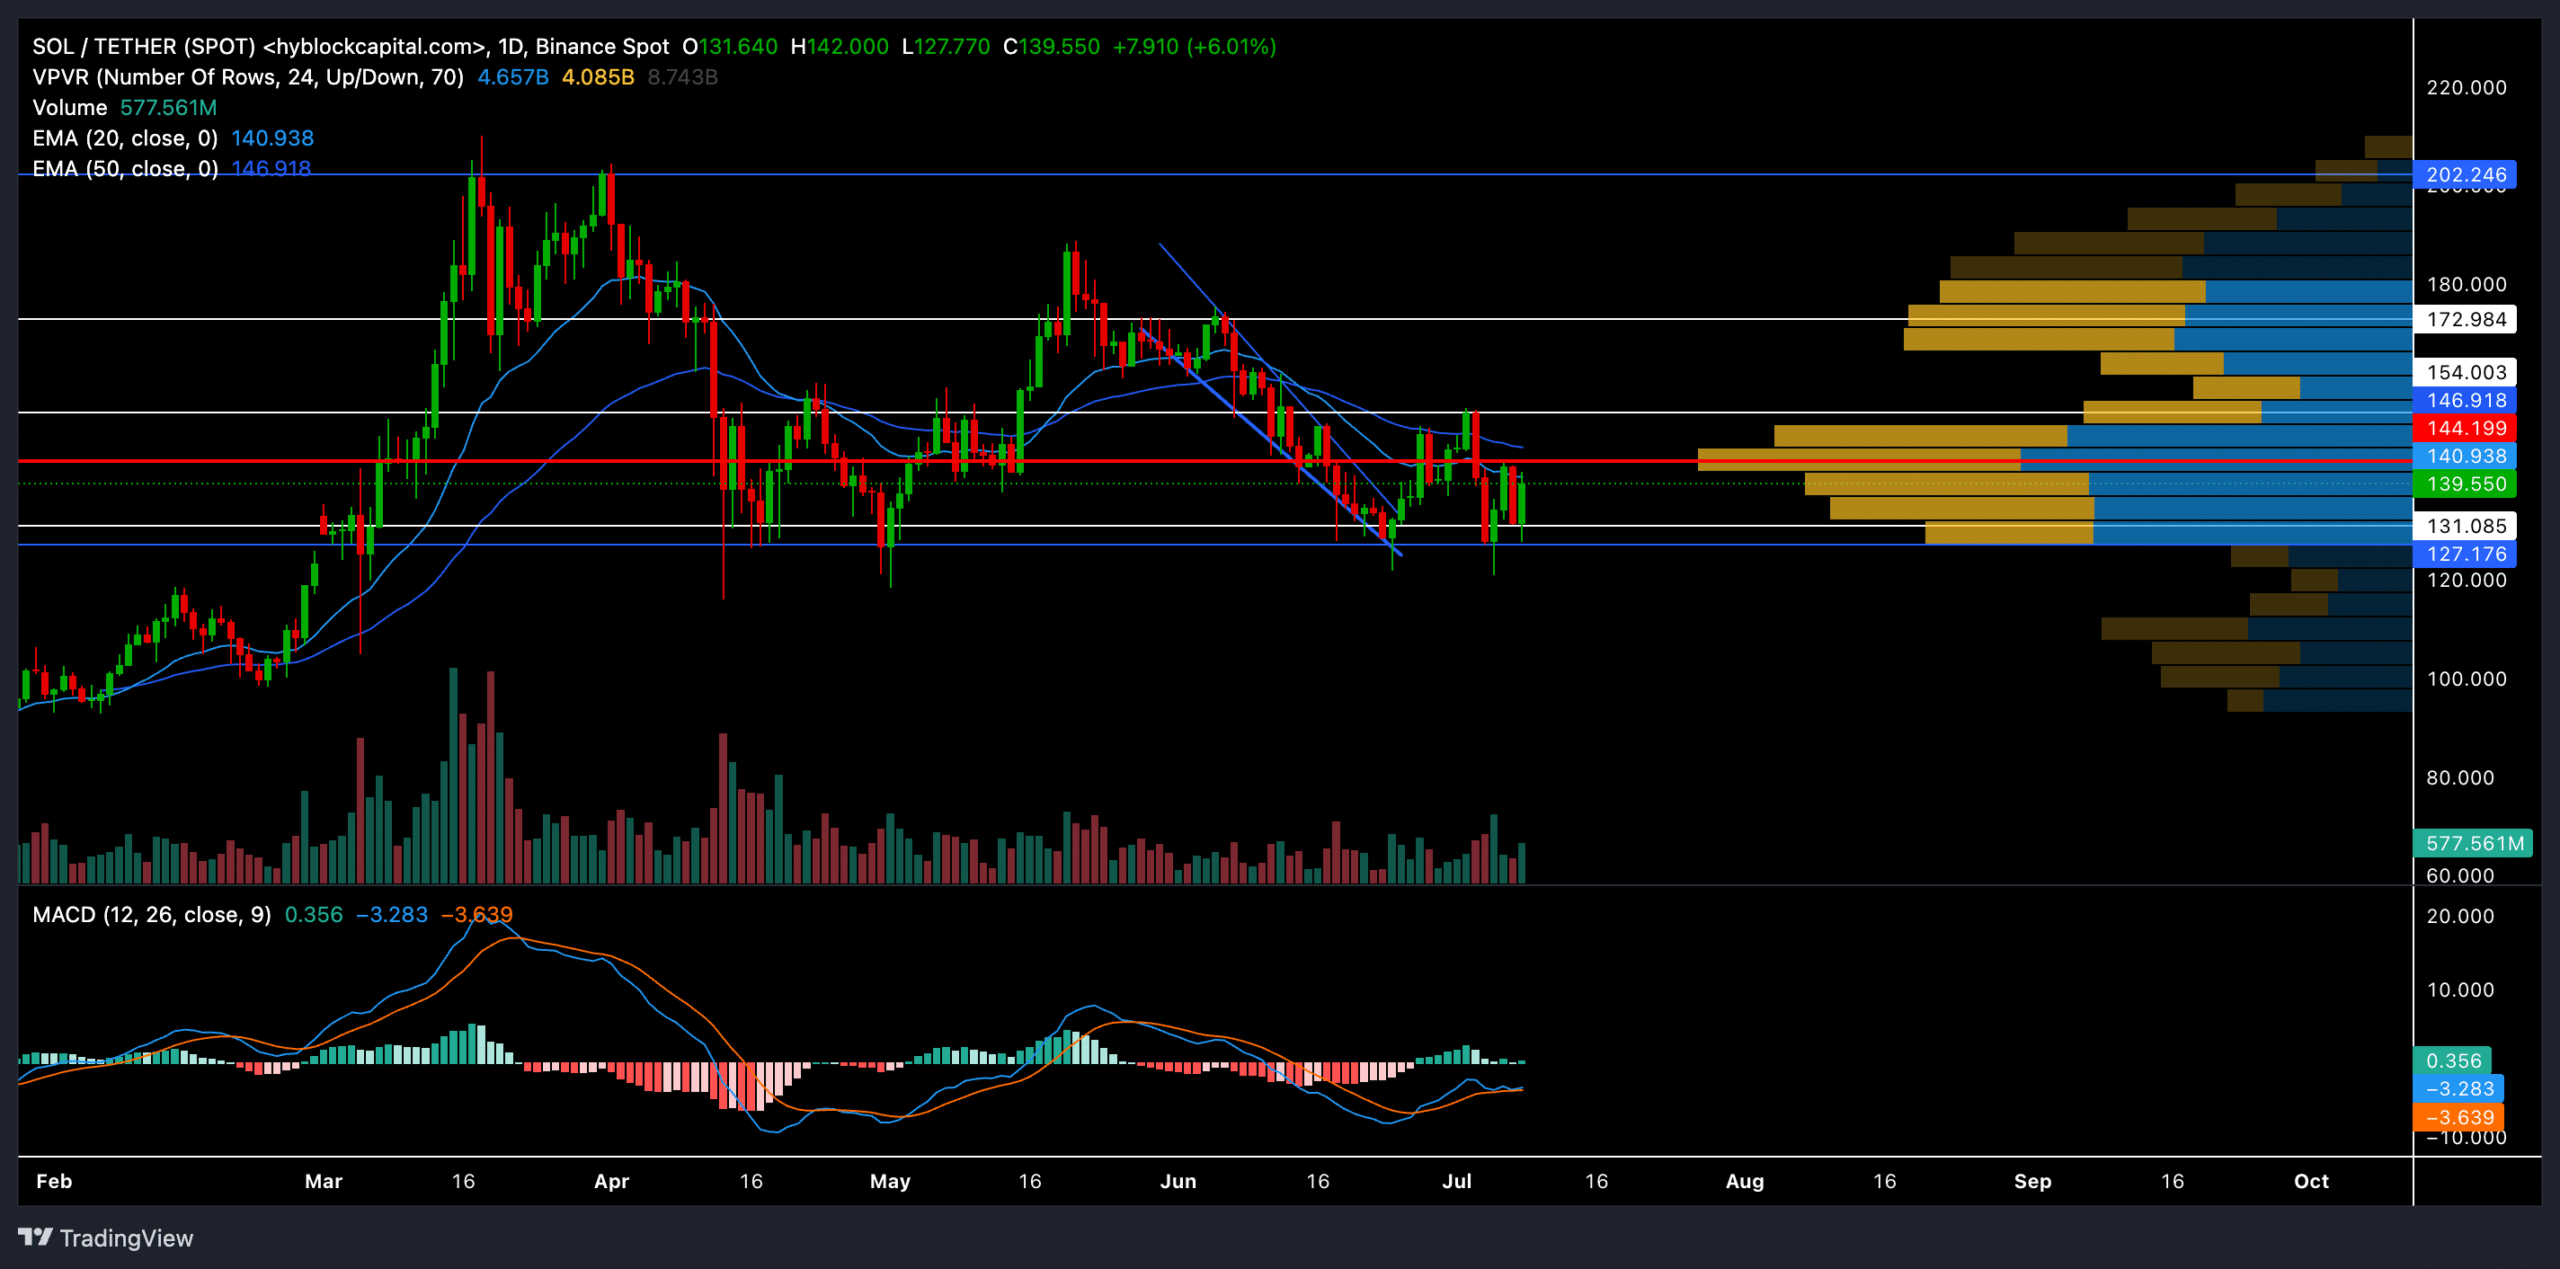
Source: Hyblockcapital, SOL/USDT
Selling pressure has been prevalent since SOL failed to break above the $202 resistance level. The altcoin lost nearly 37% of its value in the past three months as it found support near the $127 mark.
On its daily chart, SOL saw a classic falling wedge amid this downtrend. The $127 – $131 range offered strong support and propelled a reversal that helped the crypto see a northbound breakout.
As a result, the bulls retested the $154 level after the breakout. However, the 20-EMA and 50-EMA continued to pose recovery hurdles.
SOL fell toward its 200-day EMA during this downturn. The altcoin has tested this level over the past week after nearly nine months.
Here, it’s worth mentioning that the last time SOL rallied below the 200 EMA was in January 2022. During this bearish rally, it stayed below this level for around 1.5 years.
At the time of writing, the 200 EMA was around $131. This level coincided with the $127-$131 support range as well, reaffirming near-term recovery prospects from this range.
Looking forward, SOL will likely find an oscillating range between $127 and $154. Thus, traders can capitalize on reversals from either support or resistance at the above levels. Any close above the $154 can help buyers retest the $172 zone.
Please note that any close below the $127-$131 support range can expose SOL to an extended downtrend and likely provoke oversold market conditions.
At the time of writing, the MACD continued to show a bearish edge. Until the MACD lines cross the zero mark, SOL will continue its squeeze phase over the next few days.
Read Solana’s [SOL] Price Prediction 2024-25
Funding rates declined

Source: Coinglass
According to Coinglass data, SOL’s funding rates across all exchanges dipped below zero over the last few hours. The declining trend depicted a rather bearish edge. However, improvements in this number can help the altcoin regain near-term momentum.
Finally, tracking Bitcoin’s movement and overall sentiment is crucial to making a well-informed buying decision.