Solana
Solana price prediction – What does July have in store for SOL?
In the short term, Solana’s price bounce might have lost its impetus.
- Solana’s market had a bearish bias on the daily timeframe, but might sustain its long-term bullish outlook
- Defense of a Fib level, combined with the liquidity hunts, implied an uptrend might be initiated again
Solana [SOL] fell by 2.56% over the last seven days. According to CoinMarketCap, this accounted for the third-best performance among the market’s top-10 coins (without counting the stablecoins). Here, the bullish conviction might be due to hopes of a SOL ETF and the potential it has after the next U.S election.
The argument is that SOL has strength relative to the rest of the altcoin market, most of whom have lost close to double-digit percentage figures. in fact, a recent report highlighted that Solana processed many times more daily transactions than the Ethereum [ETH] network.
Fibonacci levels have been resilient
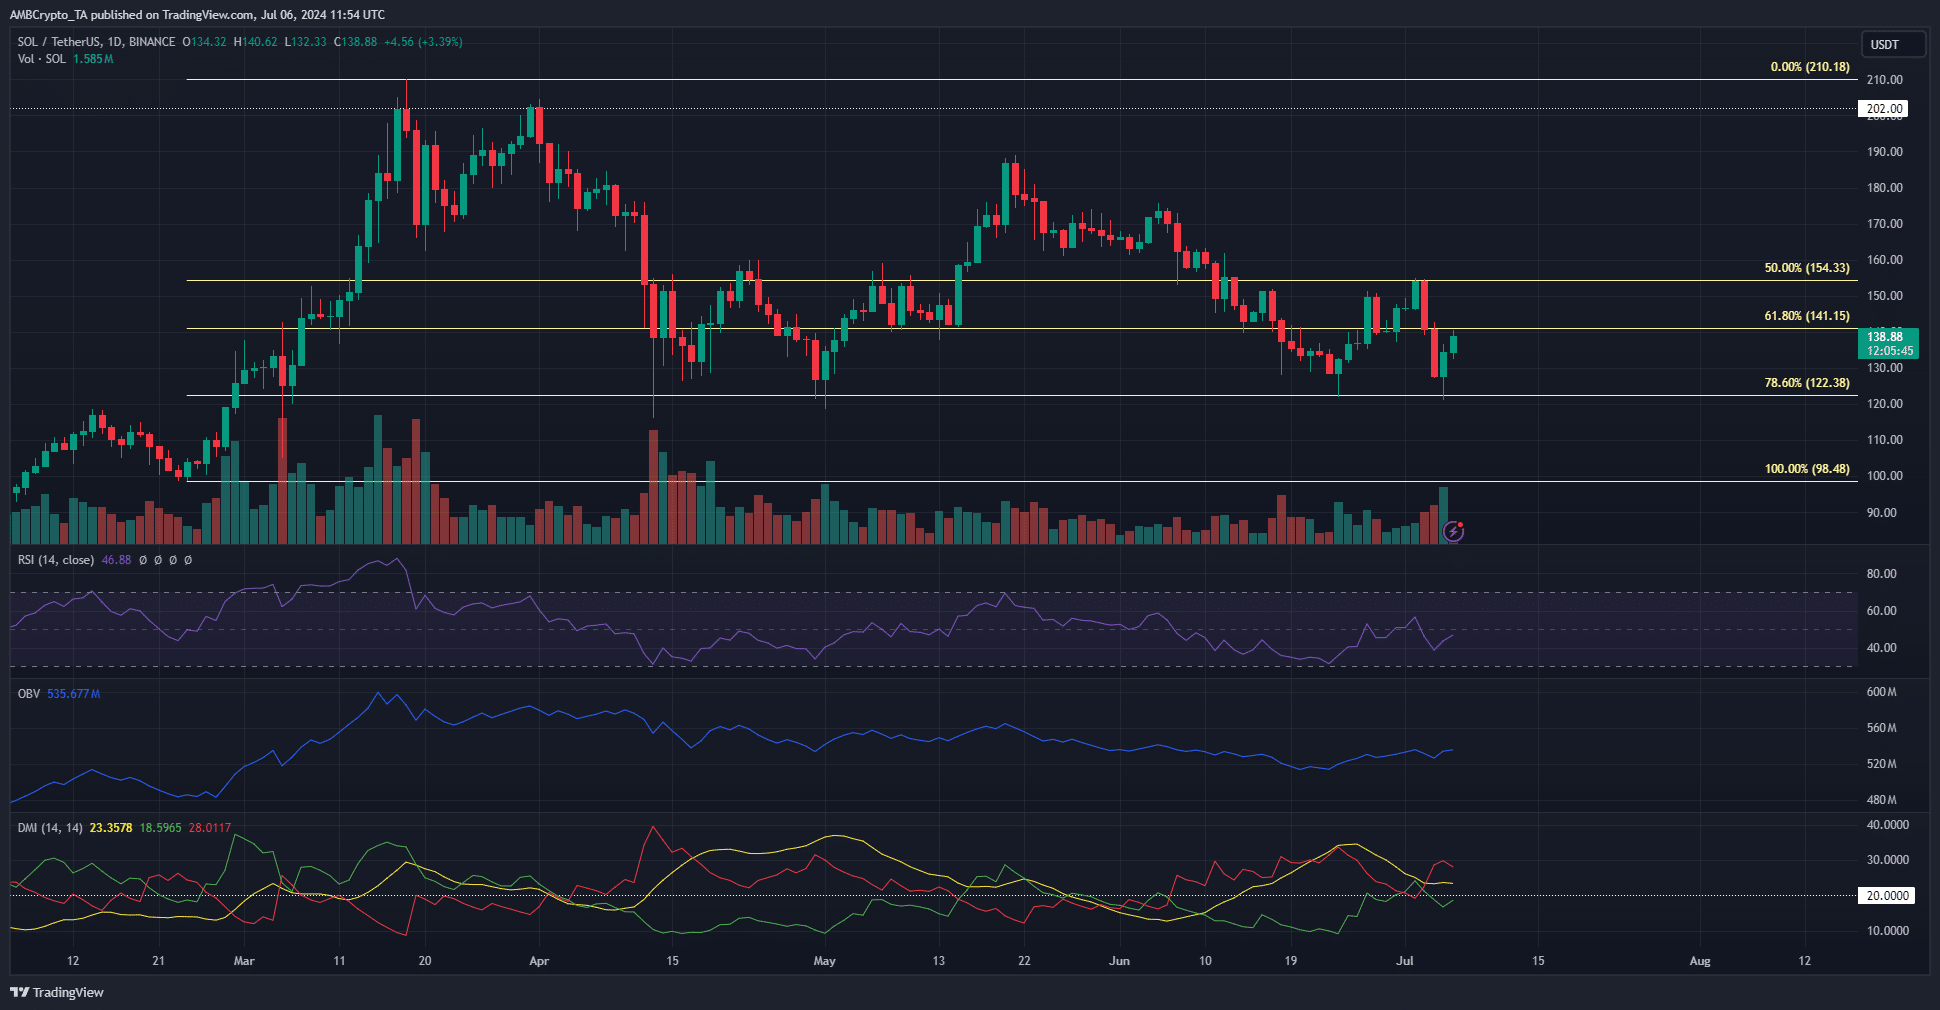
Source: SOL/USDT on TradingView
Based on the rally from $98.48 to $210.18 in February and March, a set of Fibonacci retracement levels (yellow) were plotted. The 78.6% level was retested for the fourth time since mid-April and was defended.
The OBV has slowly trended south since March, while the daily RSI has remained below neutral 50 since early June. Together, they highlighted selling pressure and bearish momentum had the upper hand.
The DMI also showed a strong downward trend in progress, with the ADX (yellow) and -DI (red) both above the 20-mark.
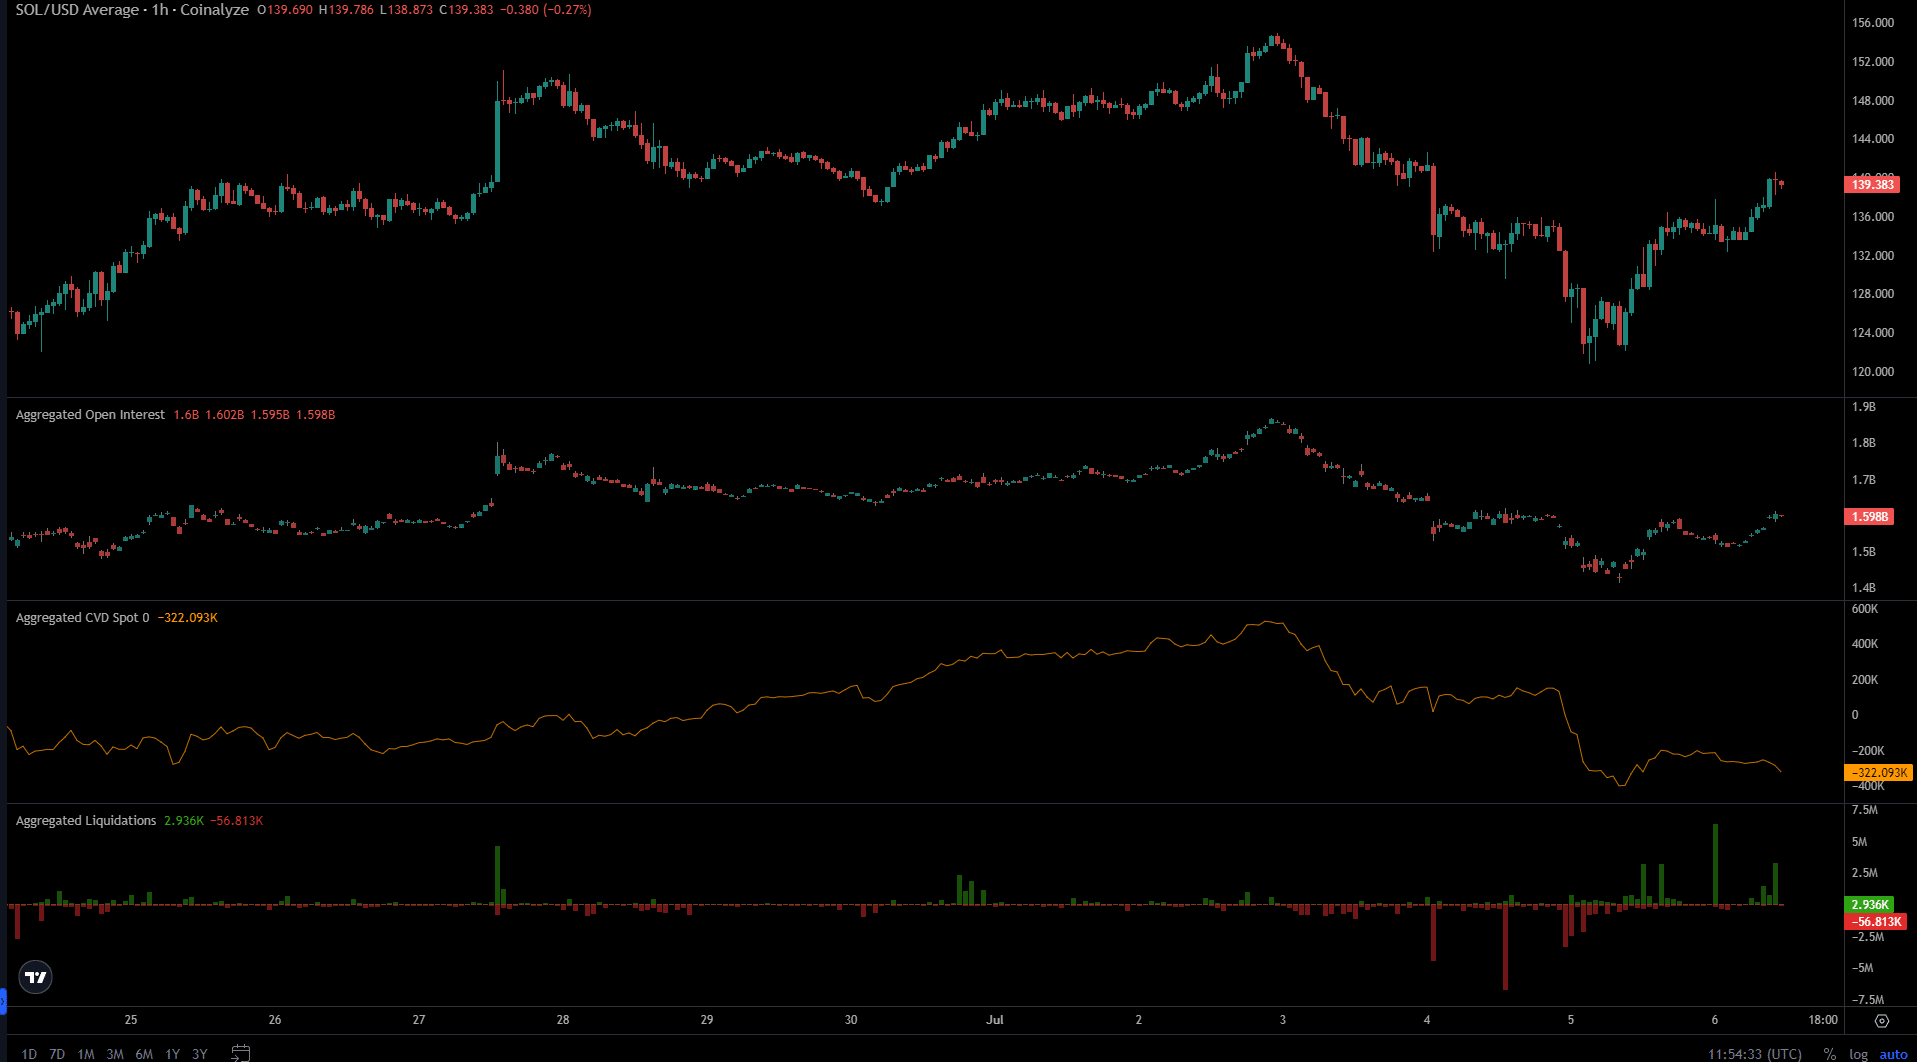
Source: Coinalyze
The spot CVD had initiated a recovery in the final week of June, but the progress was undone during past week’s sell-off. The Open Interest also took a hit. In fact, the past few hours saw the OI bounce weakly alongside the price – A sign that speculators were somewhat willing to go long, but not entirely convinced.
The short liquidations spiked a few hours before press time, showing $6.34 million short positions liquidated at $137. This suggested that the short squeeze was successful across the lower timeframes, and the next resistance zone was around $140-$143.
Clues for the next major price trend from liquidation data
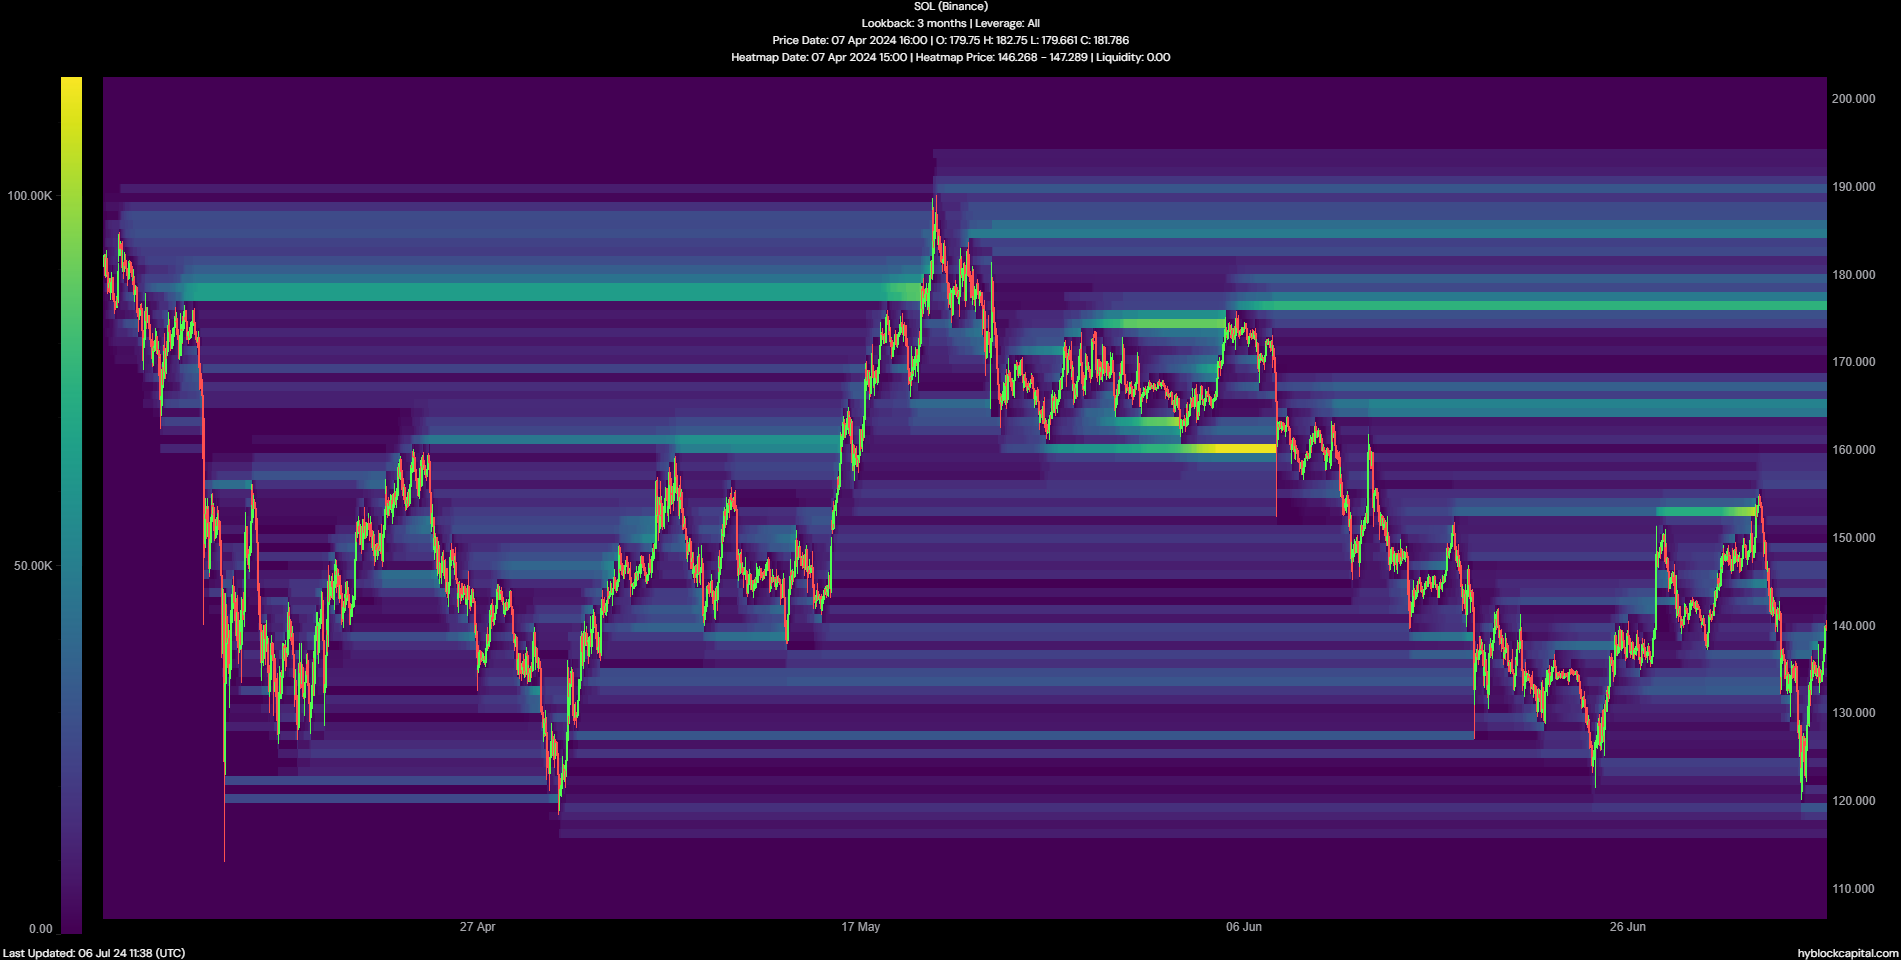
Source: Hyblock
On 2 July, Solana visited the liquidity cluster at $152 and shortly thereafter, reversed its bullish trajectory. This is an example of how prices might go against the trend in the lower timeframes to wipe out a liquidity pocket, before reverting to the original direction.
The large pockets of liquidity attract prices to them. The next one of note seemed to be at $164, with another at $175.
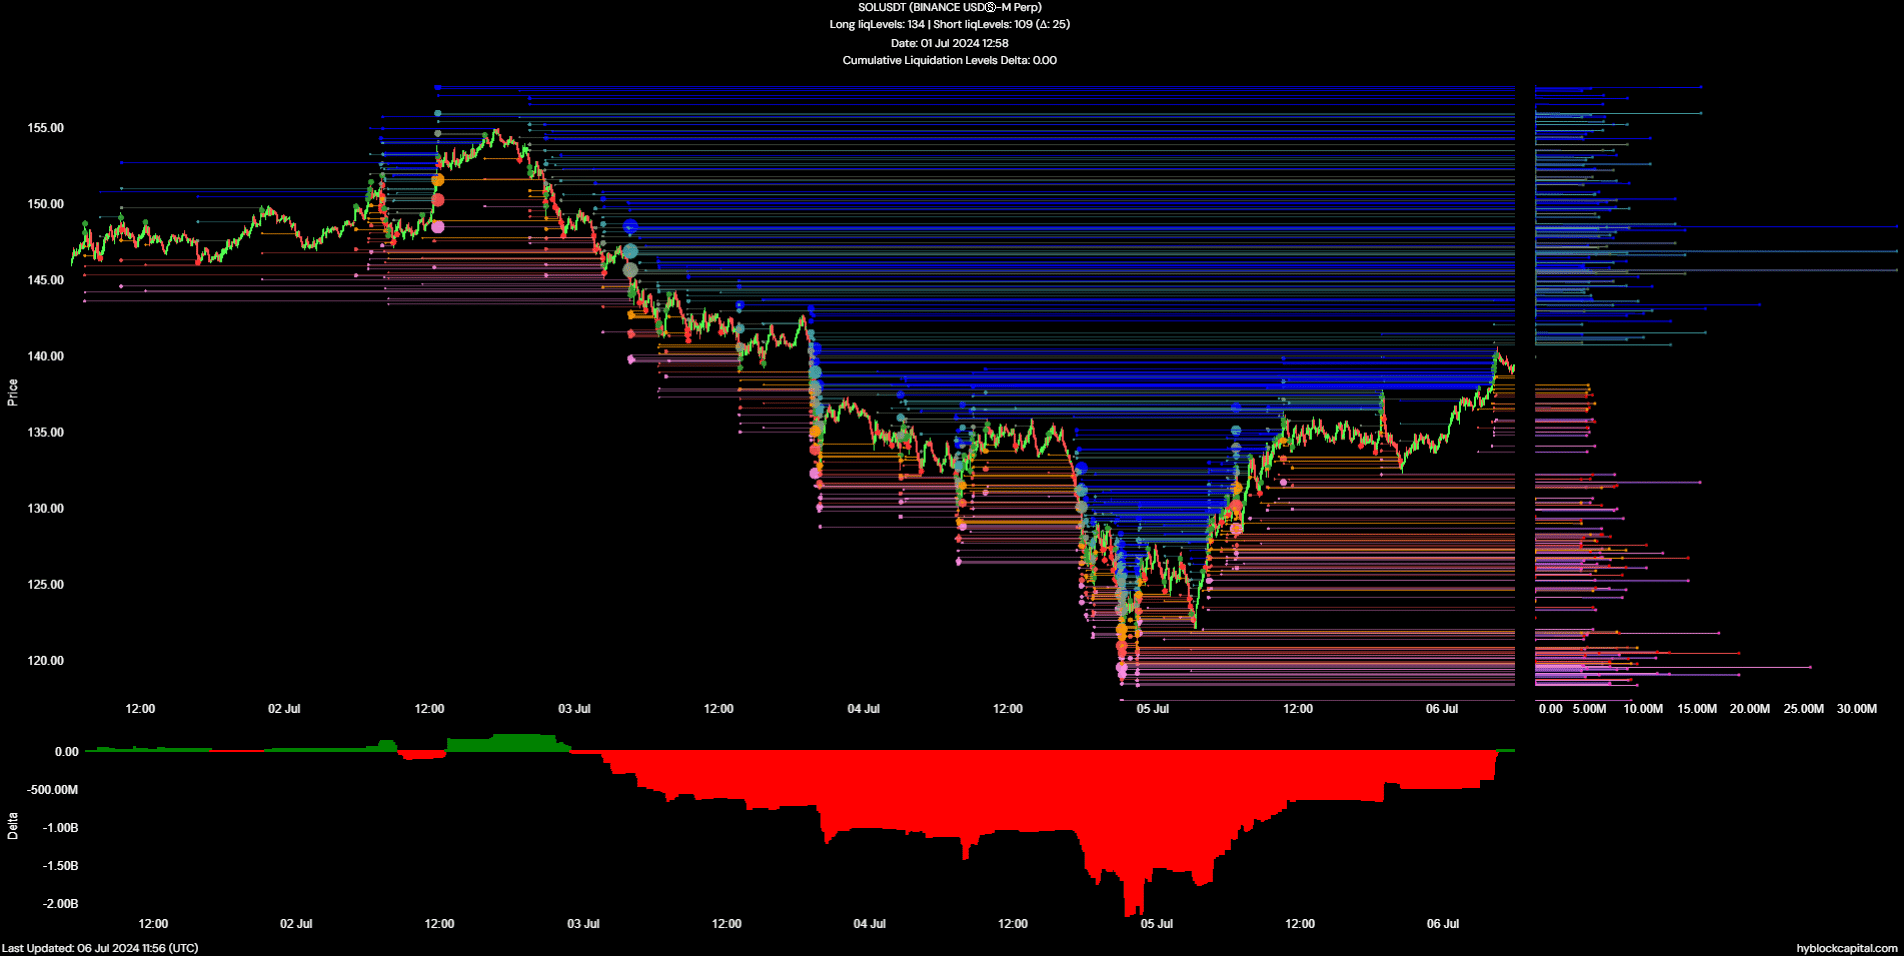
Source: Hyblock
In the short term, Solana’s price bounce might have lost its impetus. In fact, AMBCrypto’s analysis showed that the cumulative liq levels delta was positive, meaning long liquidations slightly outnumbered short ones.
Read Solana’s [SOL] Price Prediction 2024-25
In turn, the short squeeze might be over. This idea reinforced the possibility that SOL might retreat south from the $140-$143 zone. Overall, it is likely that SOL would face rejection from $140-$143 and consolidate for a few days around $135.
In the coming weeks, a Bitcoin [BTC] move above $60k might fill the bulls with the belief needed to drive a price move to $164 and $175.


