
- MATIC showed signs of an uptick towards the $1 mark, with increasing network utilization and holder accumulation.
- A recent crossover of the MA50 below the MA200 indicates a shift to a bearish trend.
Polygon[MATIC] has unexpectedly joined the altcoin rebound, showing some upward momentum and nearing the inching a little close to the $1 resistance level. The tiny surge comes after consolidation, hinting at renewed investor interest and potential for further gains.
MATIC has a relatively stable total number of addresses, indicating that the rate of new address creation is consistent.
However, the total with balances has shown a slight increase. This could be interpreted as increasing network utilization or holder accumulation, which are bullish signals.
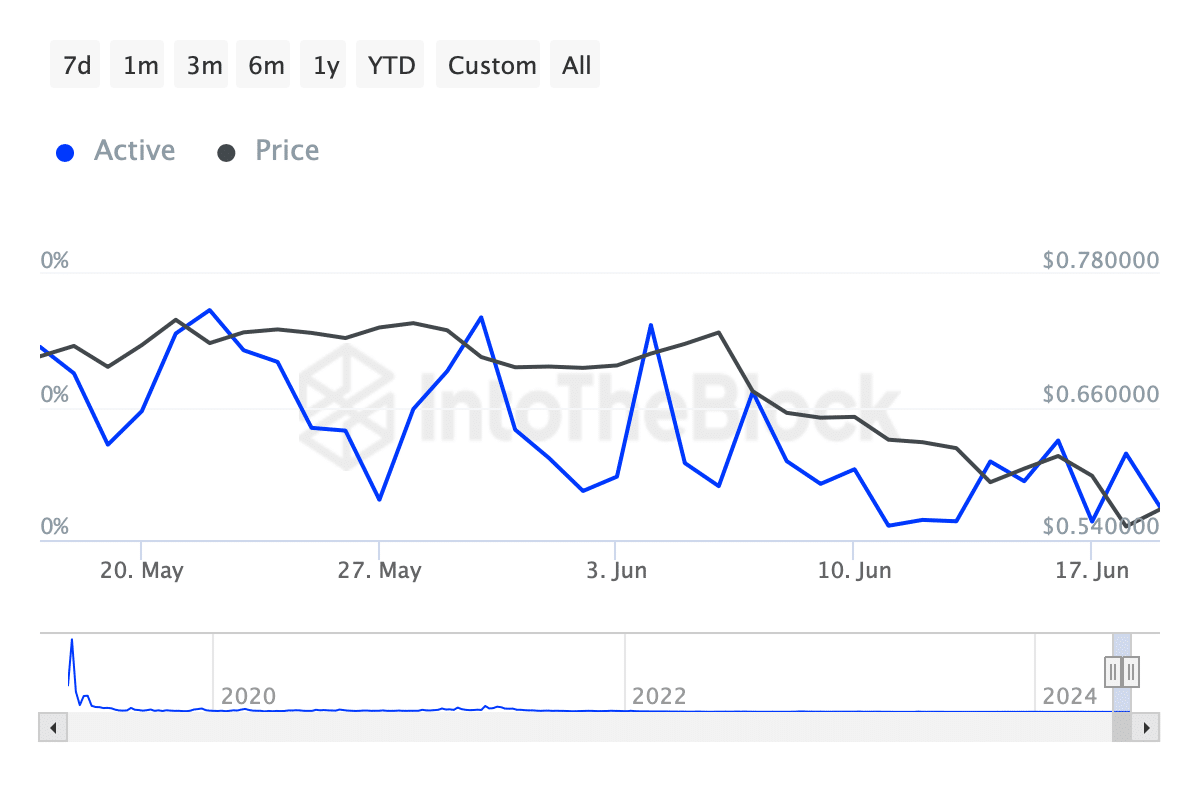
Source: IntoTheBlock
However, the percentage of active addresses has been decreasing, indicating that while the number of addresses with balances is increasing, the proportion of active addresses is dropping.
While larger holders continue to drive significant volume, there is also sustained interest from smaller holders who maintain their stakes, possibly betting on long-term growth.
This is typical in phases where cryptocurrencies exhibit consolidation followed by gradual increases in price, hinting at underlying confidence in the asset’s value proposition.
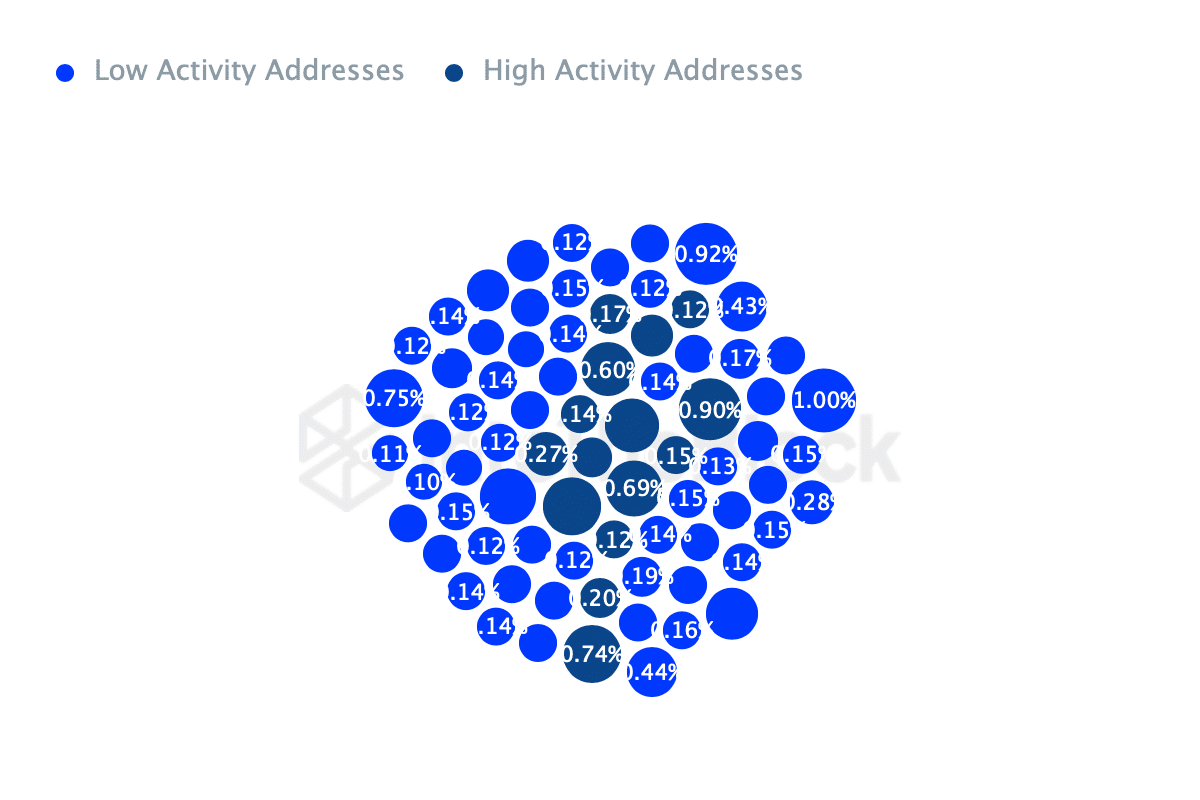
Source: IntoTheBlock
Technical indicators show…
A few days ago, the MA50 was above the MA200, indicating a short-term upward trend. But as it crossed below the MA200, it suggested a change to a bearish trend.
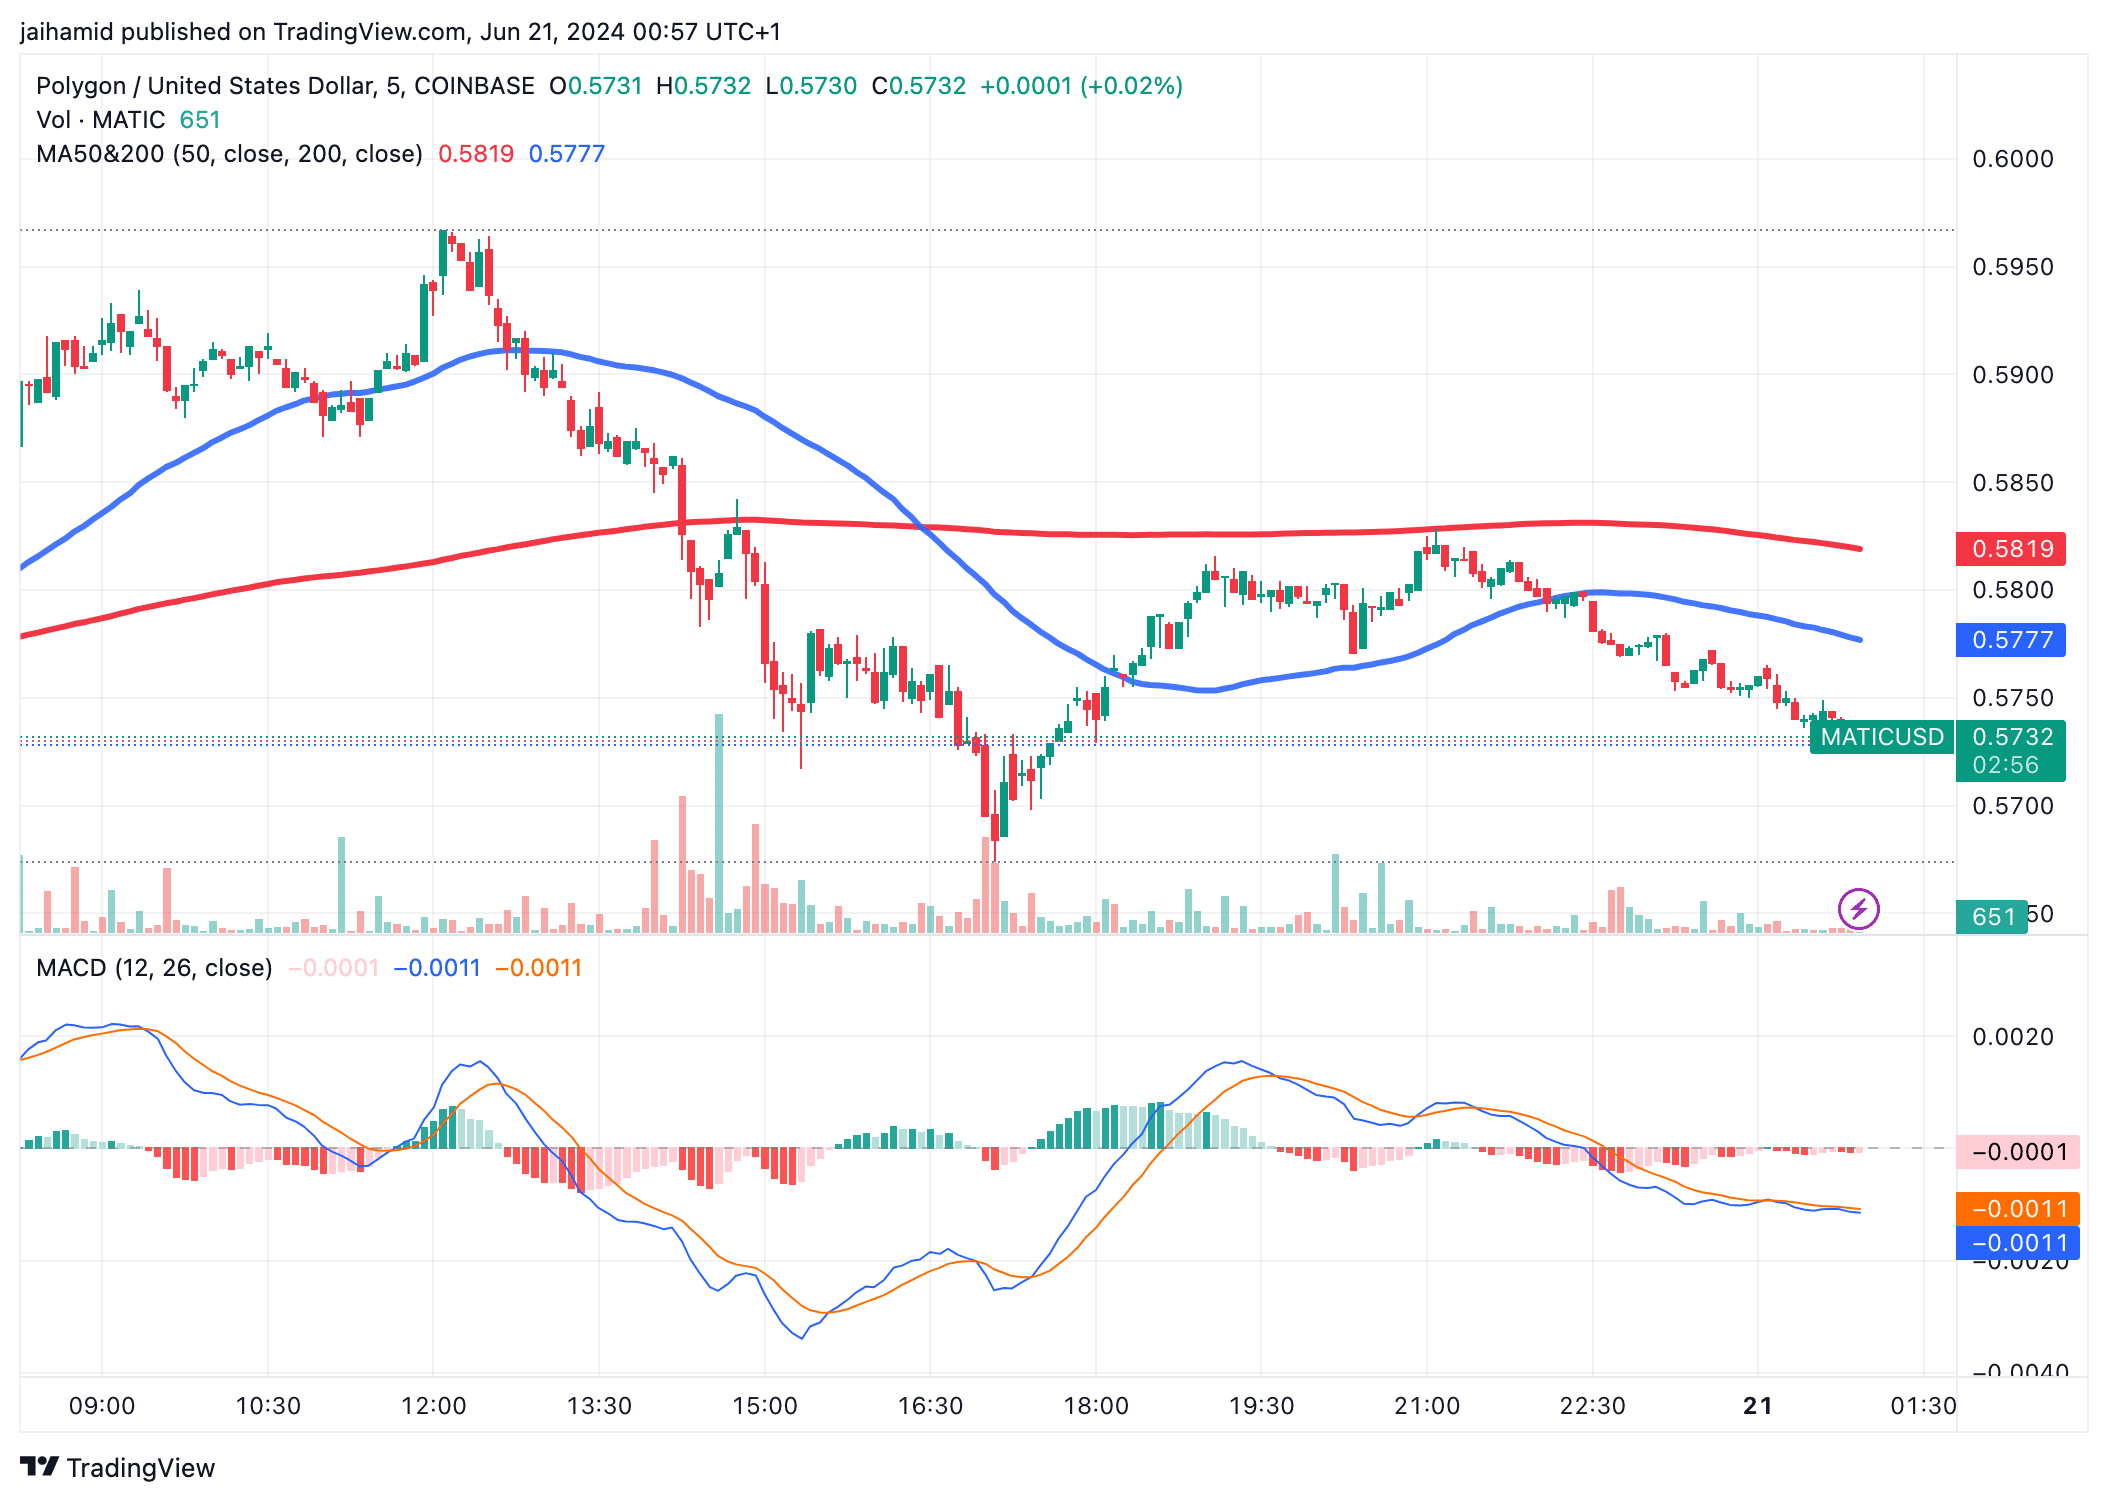
Source: TradingView
The MACD sits around the zero line and dips below it, reflecting the decreasing momentum and a bearish sentiment as the signal line crosses above the MACD line.
The Ichimoku Cloud can be seen beneath the price action on the chart below, with green and red clouds indicating bullish and bearish sentiments.
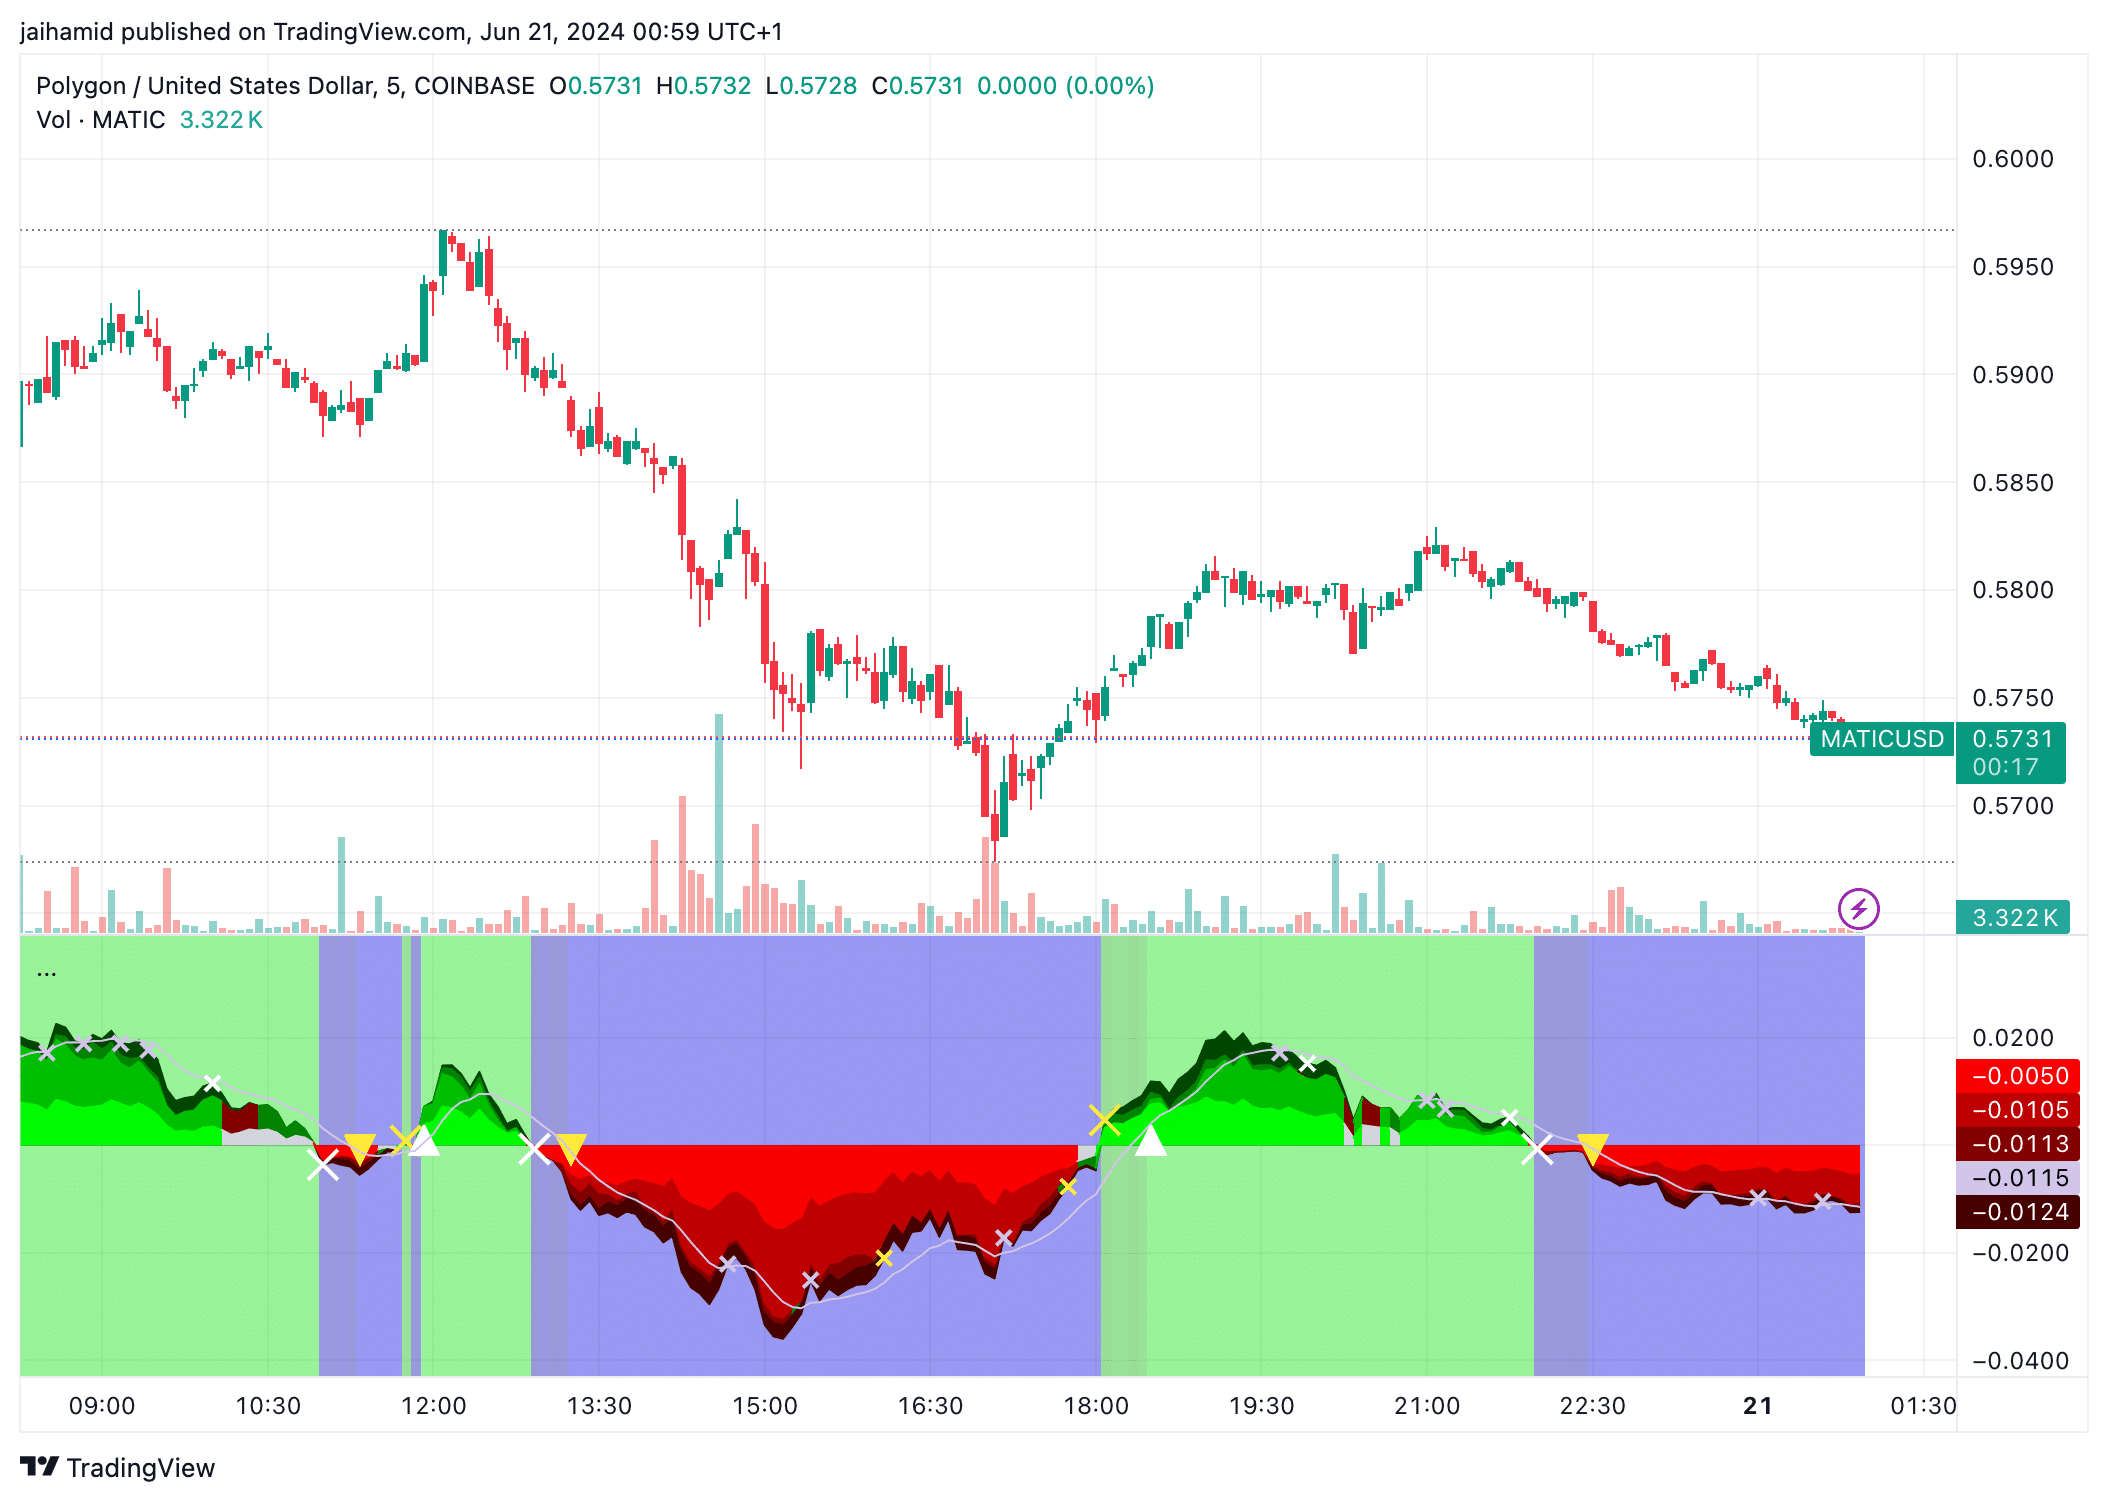
Source: TradingView
Is your portfolio green? Check out the MATIC Profit Calculator
The price mostly remained above the cloud during the first half. Thus, suggesting a bullish phase during which the market sentiment was relatively positive, possibly due to buying interest.
The price dipped into and below the cloud towards the past two days, indicating a bearish shift.