MATIC down 21% in April: Can 115K Polygon whales turn the tide in May?

- MATIC whales have accumulated more tokens in the last month.
- However, the token’s price has continued to fall.
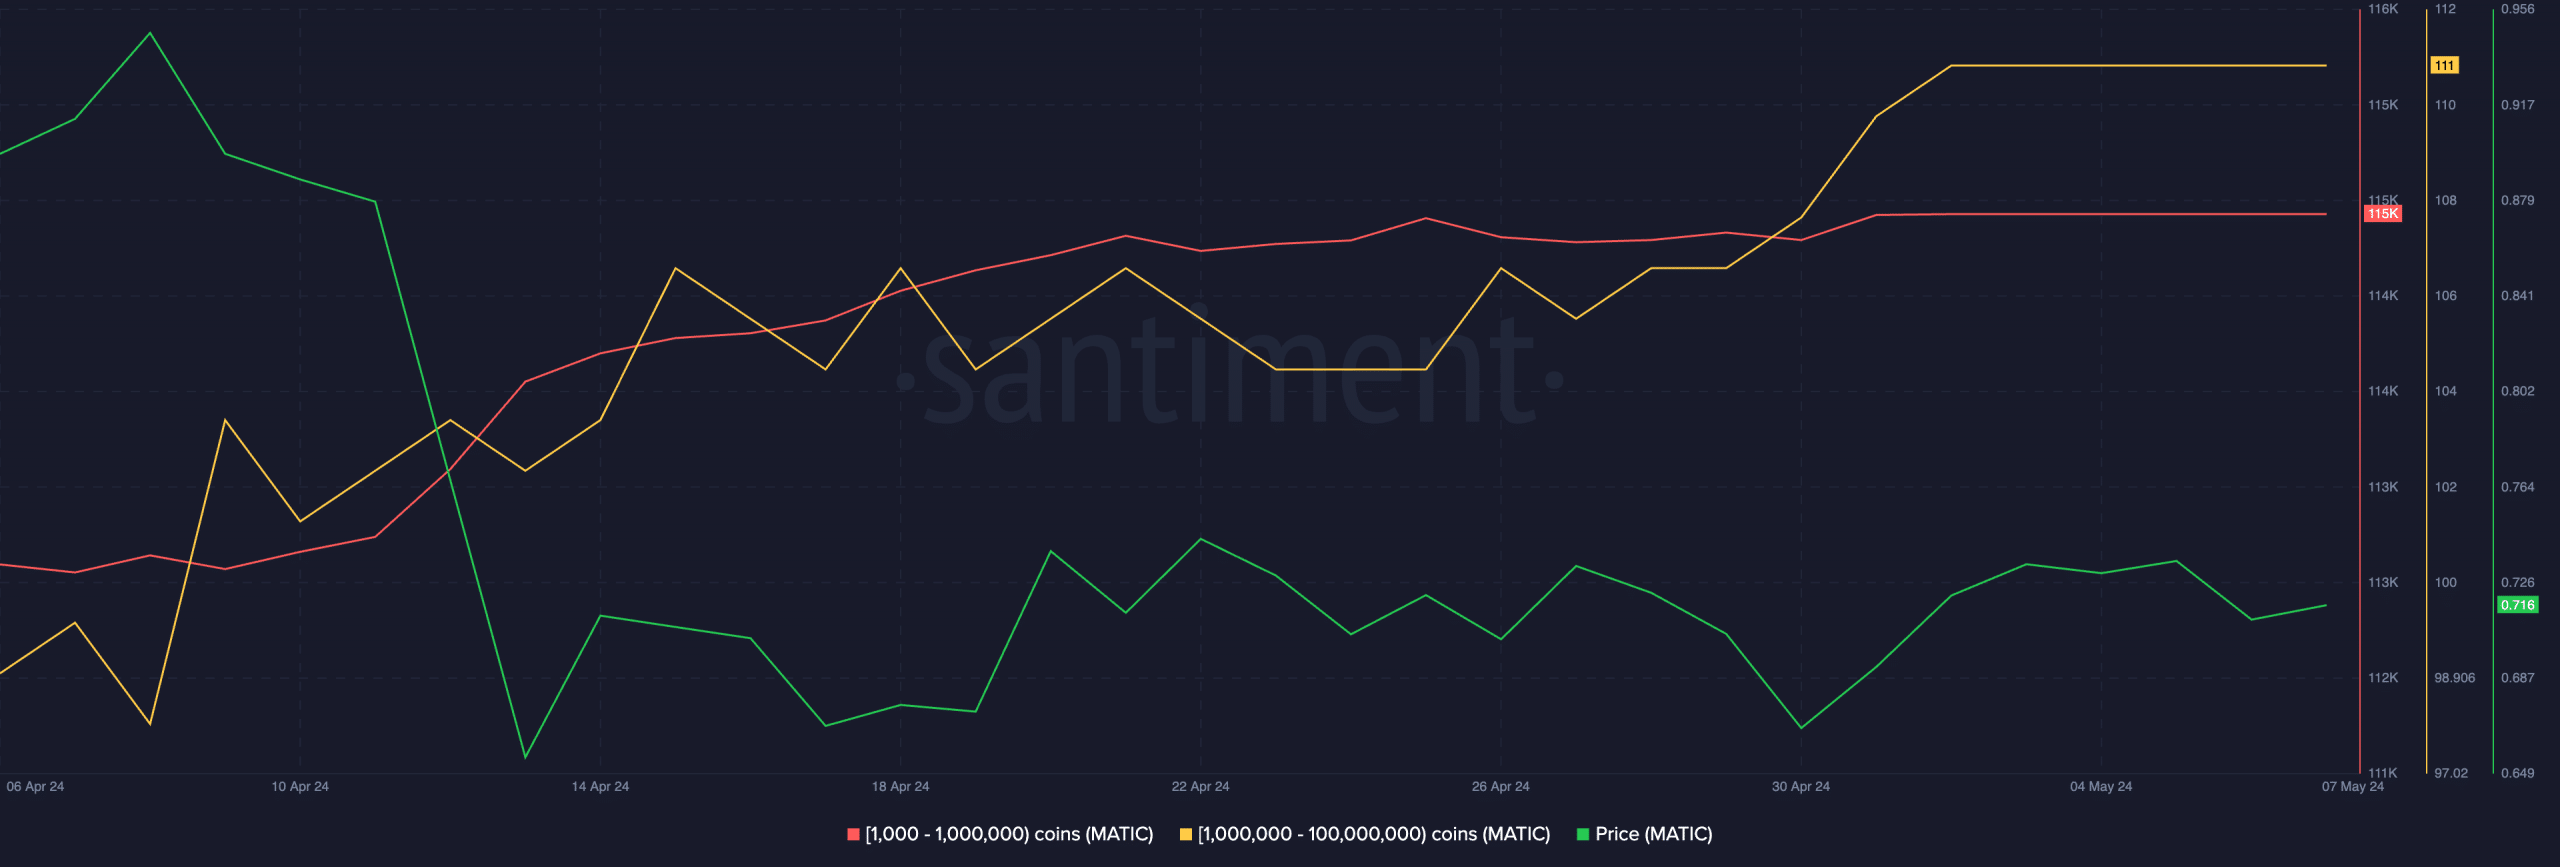
The count of Polygon [MATIC] whales has rallied in the last month despite the double-digit decline in the value of the Layer-2 (L2) token, according to Santiment’s data.
According to the on-chain data provider, the number of MATIC whales that hold between 1,000 and 1,000,000 tokens has increased by 2% in the past 30 days.
As of this writing, this cohort of MATIC holders was 115,000.
Likewise, bigger whales with between 1,000,000 and 100,000,000 MATIC tokens have increased their accumulation. During the period under review, their count has gone up by 5%.
As of this writing, they held 21% of MATIC’s circulating supply of 9.8 billion tokens.
MATIC is due for further decline
Despite the surge in whale activity in the last month, MATIC’s price has not seen any rally. Its price has declined by 21% within that period, per CoinMarketcap’s data.
At press time, the altcoin exchanged hands at $0.72.
MATIC’s price decline in the last month mirrors the general decline recorded in the cryptocurrency market during that period.
Due to the fall in trading activity, the global cryptocurrency market capitalization has fallen by 11% in the past 30 days, according to CoinGecko’s data.
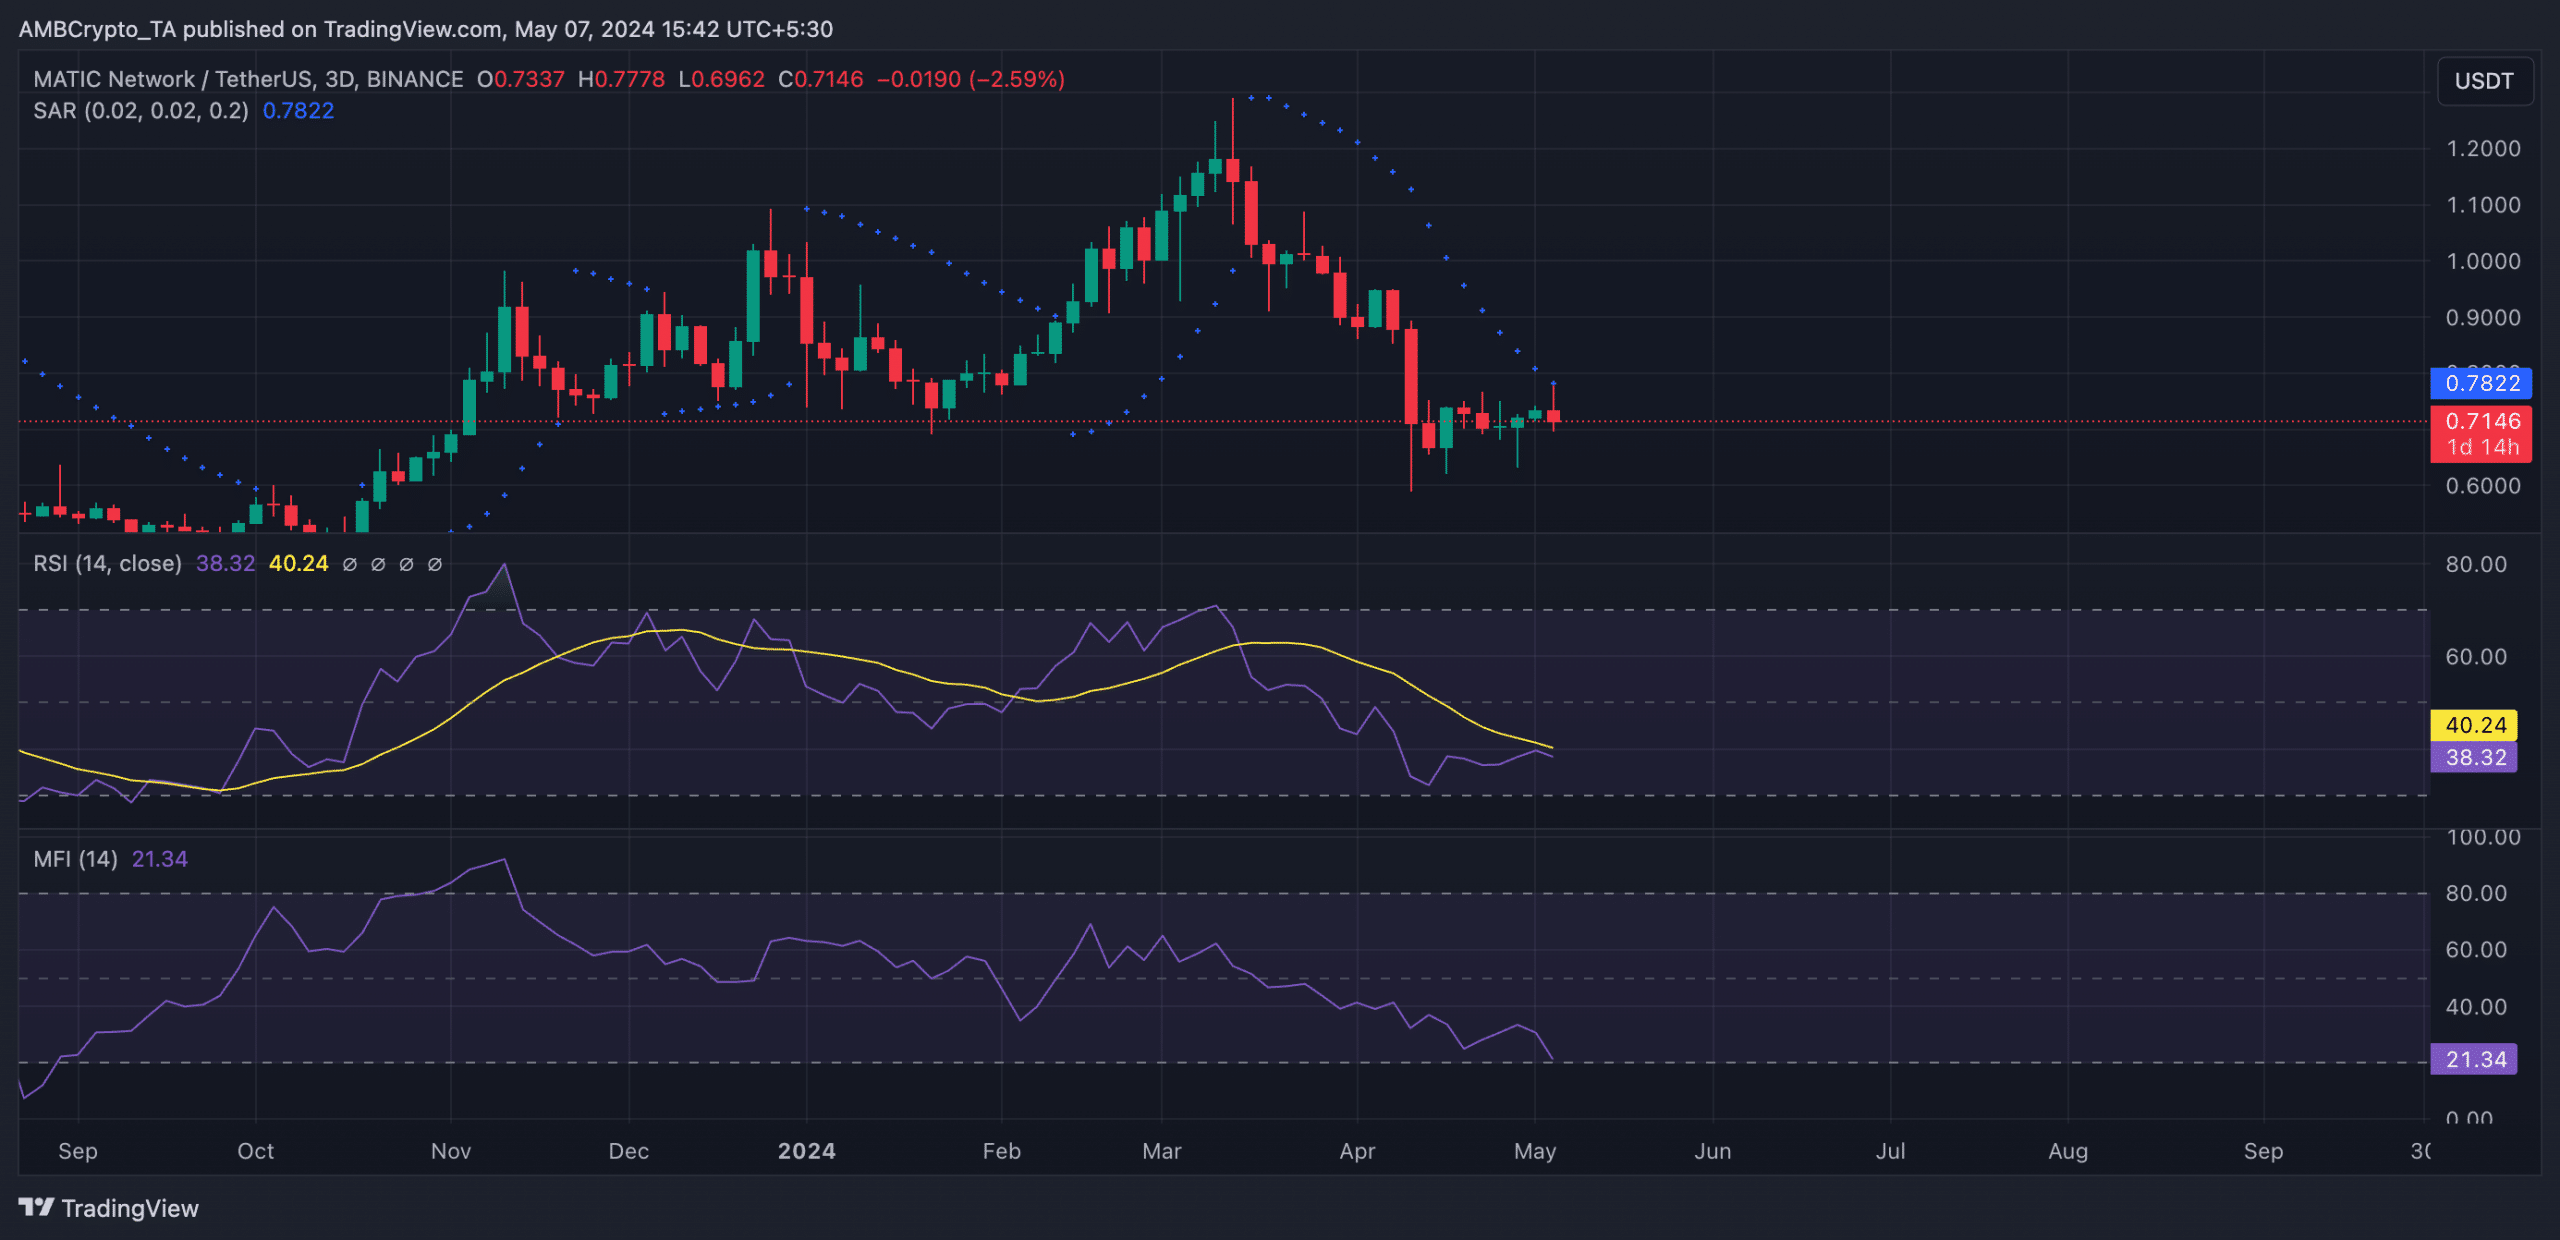
AMBCrypto assessed MATIC price movements on a 3-day chart and found a significant decline in demand for the L2 token by market participants.
The key momentum indicators observed were below their respective center lines at the time of writing.
For example, MATIC’s Relative Strength Index (RSI) was 38.41, while its Money Flow Index (MFI) was 21.34.
At these values, these indicators showed that the altcoin was oversold, as the bears mounted significant downward pressure on its price.
Read Polygon’s [MATIC] Price Prediction 2024-2025
Confirming the bearish activity in the MATIC activity, its price rested below the Parabolic SAR indicator at press time. The indicator is used to identify potential trend direction and reversals.
When its dotted lines are placed above an asset’s price, the market is said to be in a decline. It indicates that the asset’s price has been falling, and may continue to do so.


