Litecoin
Litecoin – Large withdrawals and how they might dictate LTC’s price action
Litecoin is in a tough position right now, despite its latest hike. Will it be enough?
- LTC’s recent gains might be hindered by large holders’ sell-offs
- On-chain data revealed a strong support at $61.27, and could be critical to overcoming the overhead resistance
Though Litecoin’s [LTC] price has been able to regain a part of its losses, it faces an uphill challenge ahead of it. AMBCrypto discovered this after analyzing the altcoin’s Large Holders Netflow.
This week, Litecoin’s price could not resist plunging like the rest of the market. On 5 July, the value of the cryptocurrency tumbled to $57.55. However, the last 24 hours came with a 7.05% hike as LTC changed hands at $62.50.
Litecoin hotshots are leaving the coin
Despite the hike though, it is uncertain if the cryptocurrency will sustain its latest jump. In fact, according to data from IntoTheBlock, Large Holders Netflow was down 95.84% in the last 7 days, at the time of writing.
Put simply, the metric is the difference between the Large Holders Inflow and the Large Holders Outflow. For context, large holders are addresses holding at least 0.1% to 1% of the total circulating supply.
When the netflow is positive, large investors are accumulating more than they are selling. On the contrary, when it is negative, it implies that these holders are selling more than they are buying. This is the case with LTC too.
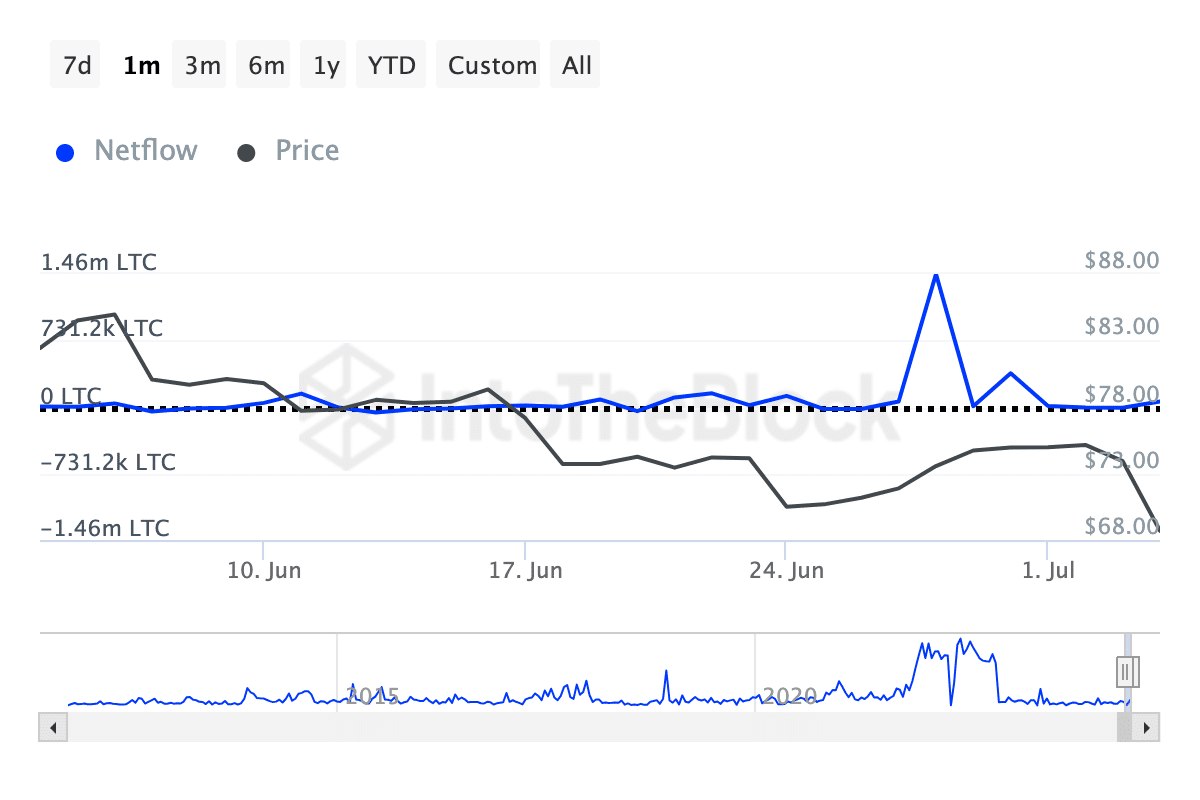
Source: IntoTheBlock
Should the metric remain negative, Litecoin’s uptrend might be halted. However, if the inflows begin to outpace outflows, the value could trade above $60 in the short term, and possible move closer to $70.
That being said, AMBCrypto considered it necessary to evaluate other datasets to lend some insights into LTC’s potential direction. To do this, we evaluated the altcoin’s Investor Capitalization.
LTC’s price close to the bottom, could trade higher
This metric is the difference between Realized Cap and Thermocap. The outcome of this calculation indicates if the coin has hit the top or if the bottom is in.
If Investor Capitalization spikes, it suggests that the coin is close to the top of this cycle. However, if the reading is low, it means that the price is close to the bottom.
According to Glassnode, the metric was at a low point, indicating that LTC might be undervalued.
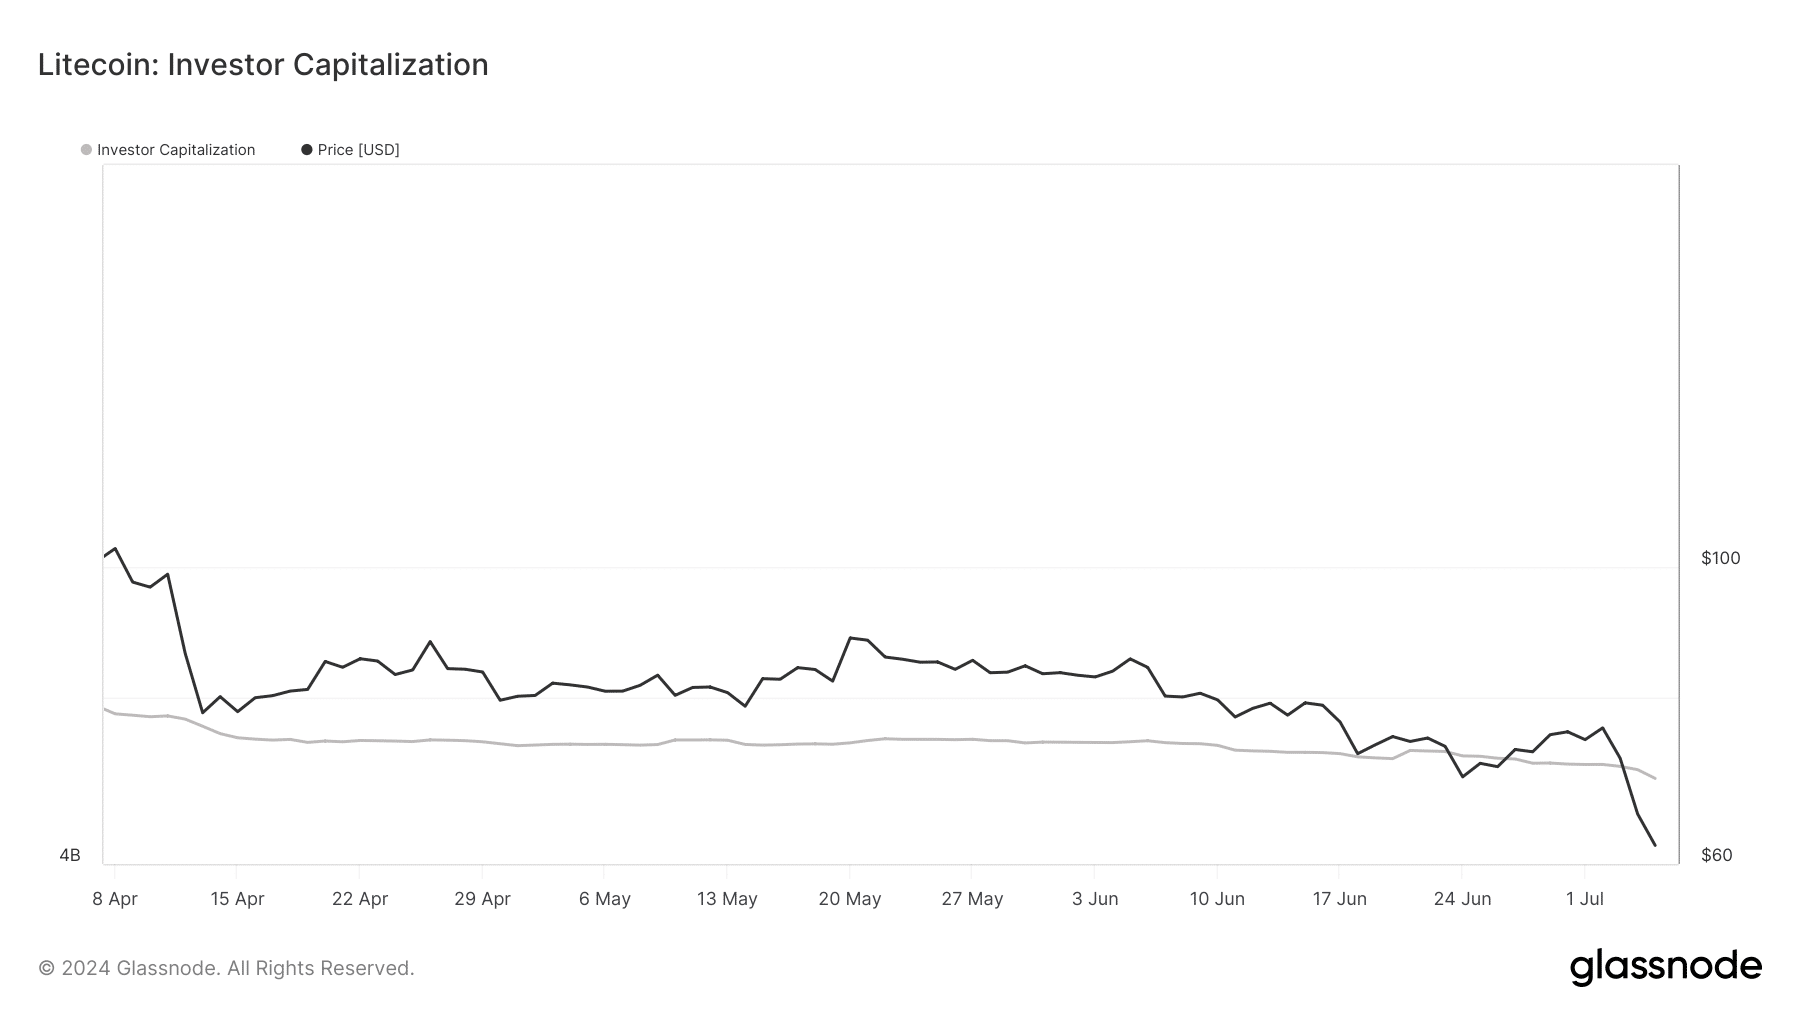
Source: Glassnode
As far as the short-term outlook is concerned, AMBCrypto then looked at the In/Out of Money Around Price (IOMAP) indicator. The IOMAP groups addresses into those in profit and those in loss, depending on their average accumulation price.
As a result, the metric acts as support or resistance. The larger the cluster of addresses within a price range, the stronger the support or resistance.
At press time, data showed that 128,140 addresses bought 485,190 LTC at a average price of $63.39. This cohort was out of money. On the other hand, 135,090 addresses purchased 1.51 million LTC around $61.27. This cohort was in the money.
Since there was a larger amount of addresses at a lower value, it suggested Litecoin has strong support on the charts. Considering this position, there is a high chance that Litecoin would flip the resistance at $63.39.
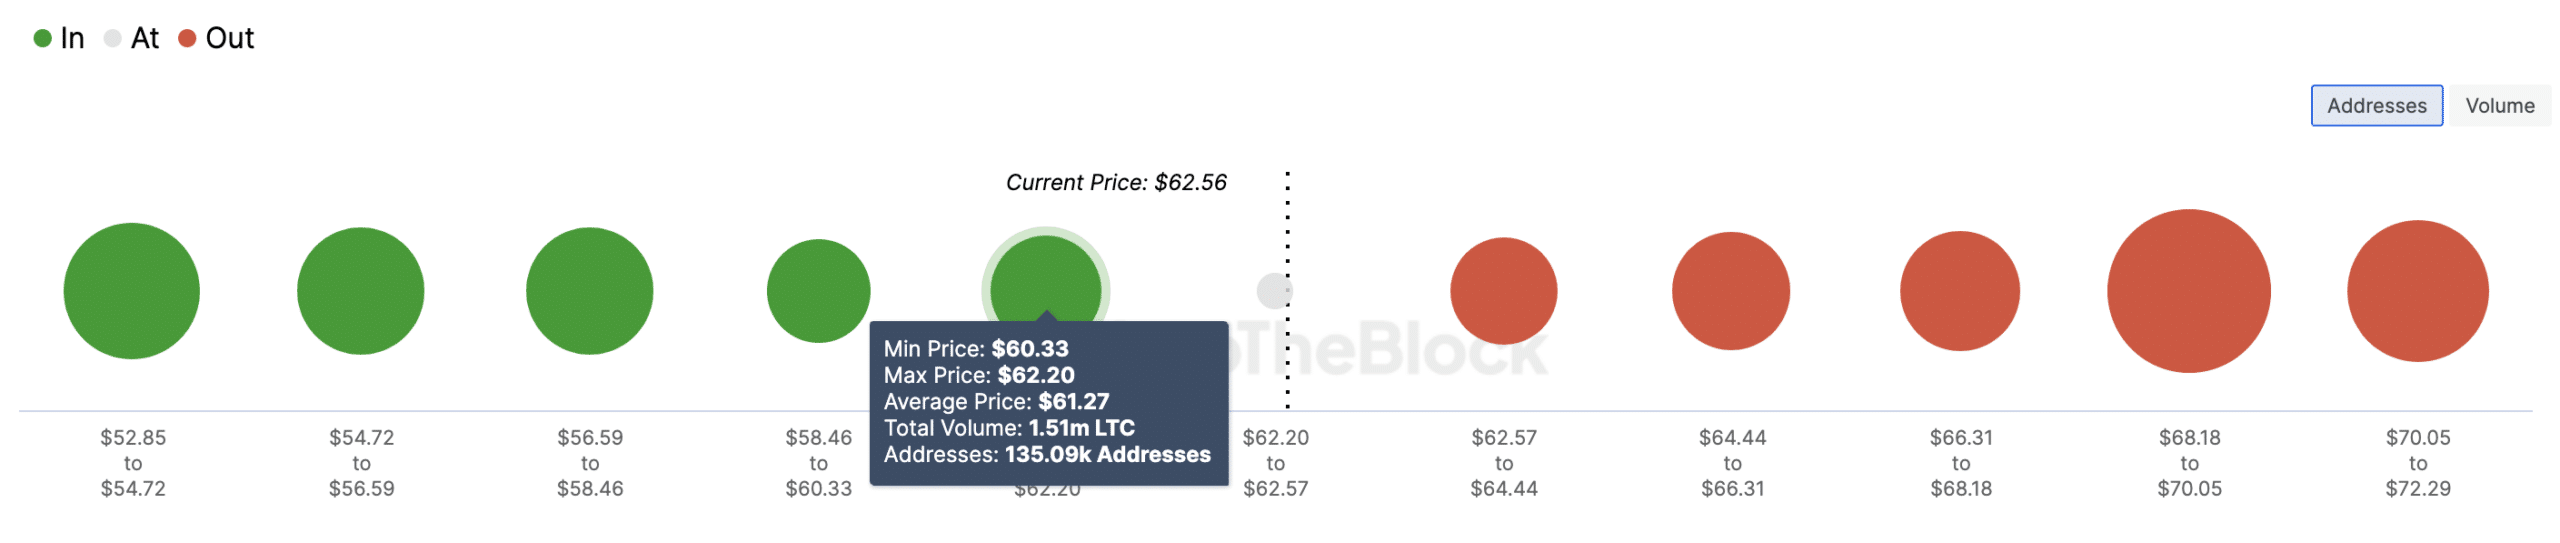
Source: IntoTheBlock
Is your portfolio green? Check the Litecoin Profit Calculator
If this happens, LTC could hit $65.35 in a few days. However, this prediction might be invalidated if large holders of the coin continue to sell.
Should this be the case, LTC might drop below $60 again.


