Memecoins

GameStop [GME] price falls 55% in 7 days, 76% down from ATH: What’s next?
Posted:
Journalist
![GameStop [GME] price falls 55% in 7 days, 76% down from ATH: What's next?](https://stage.ambcrypto.com/wp-content/uploads/2024/06/GME-1200x686.jpg)
- GME has lost over 55% of its value in the past seven days.
- If selling persists, its price might fall to the $0.006 level.
GameStop’s [GME] price has fallen by over 55% in the last week, making it the cryptocurrency asset with the highest losses during that period, according to CoinMarketCap’s data.
At press time, the altcoin exchanged hands at $0.008006. The decline in GME’s value comes after it rallied to its all-time high (ATH) of $0.032 on the 7th of June.
As market participants scamper to take profits, the token’s value has since declined by 76%.
GME sees decline in social activity
AMBCrypto earlier reported that GME saw significant social activity, contributing to its rally to the ATH. In fact, the social discourse around the token exceeded that of the leading meme coin, Dogecoin [DOGE].
However, since GME’s price began declining, its social activity has fallen. According to Santiment’s data, the token’s social dominance has dropped by 84%, while its social volume has plummeted by 52%.
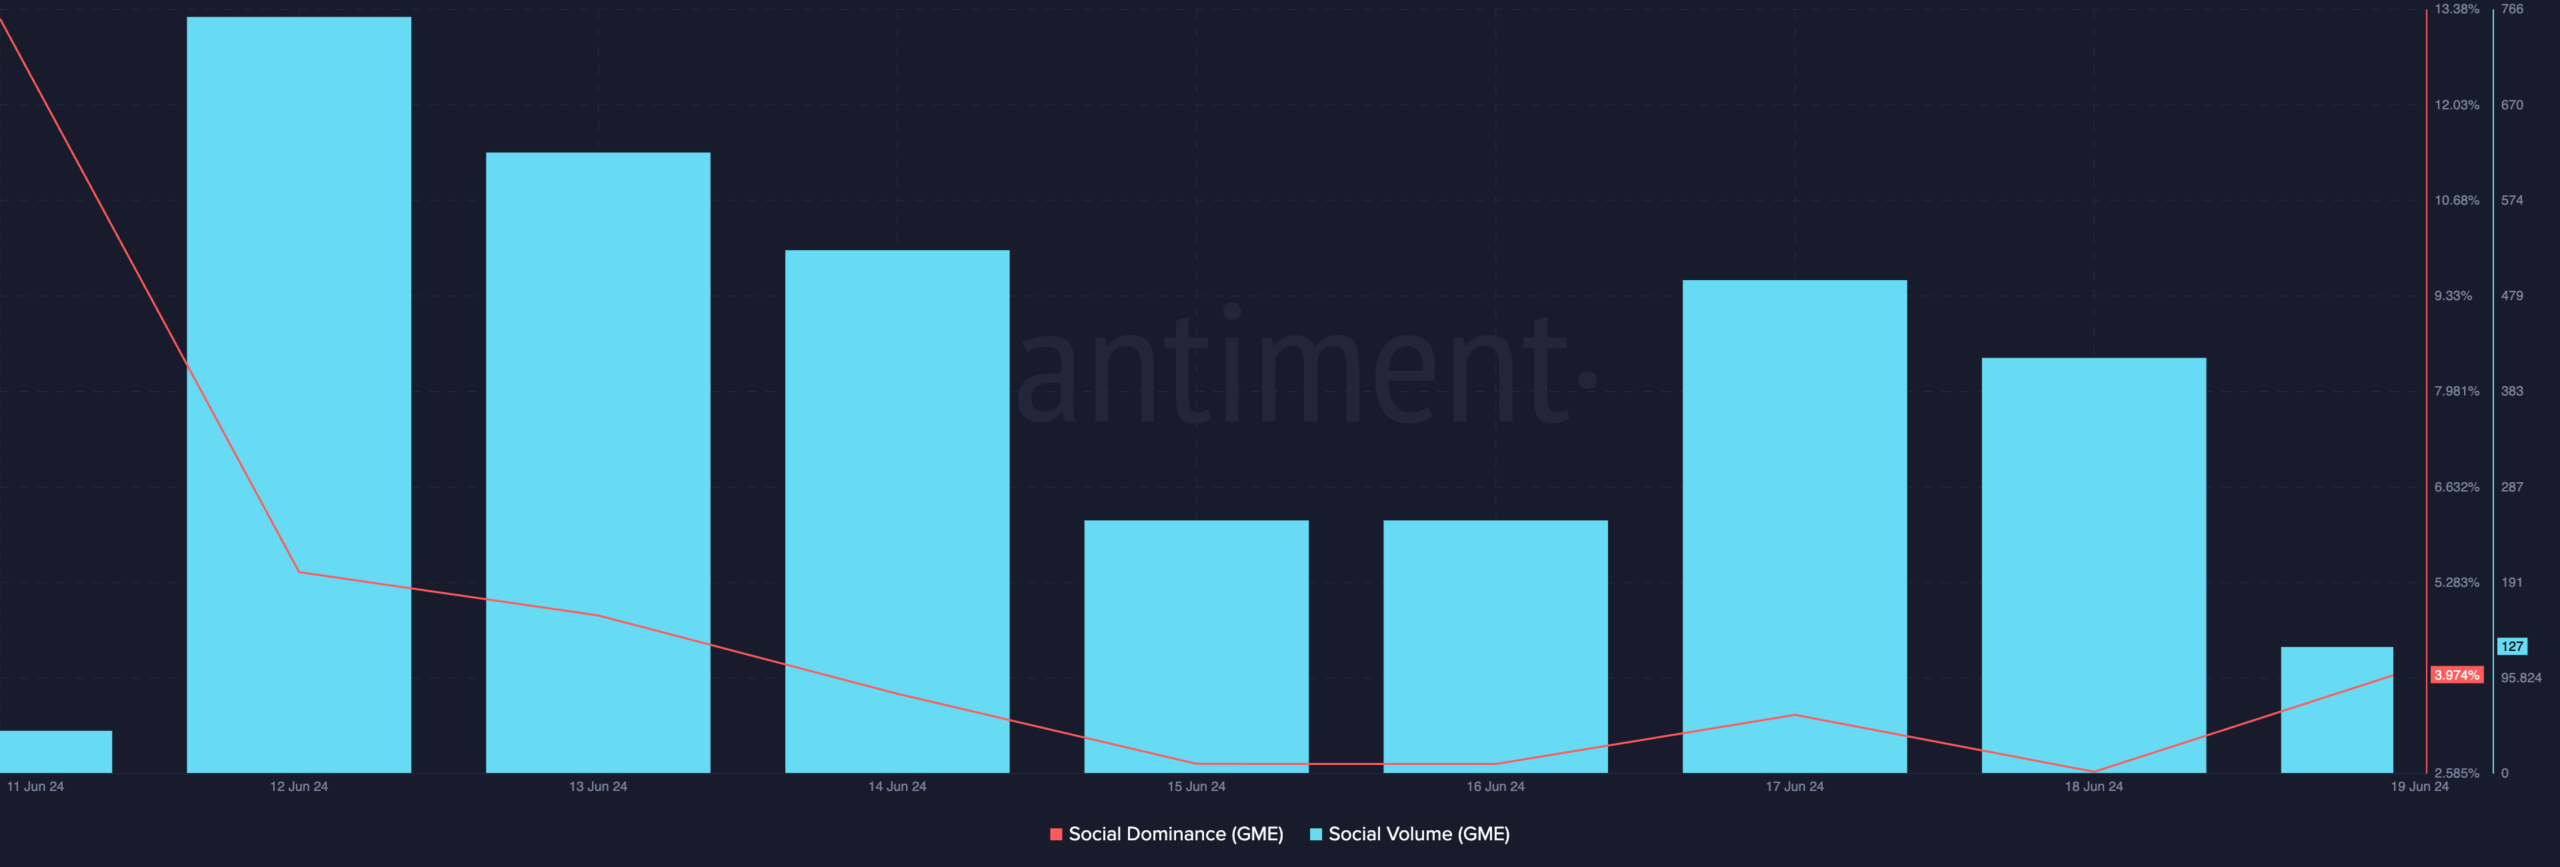
Source: Santiment
An asset’s social dominance measures the percentage of social media discussions about it compared to the top 100 cryptocurrencies by market capitalization.
On the other hand, social volume tracks the total number of online mentions of an asset.
When these indicators decline, it suggests a reduced discussion about the asset. This is a bearish signal that often suggests low market activity.
The low activity in the GME market was confirmed by its declining daily trading volume. It has fallen by over 205% in the past seven days, according to Santiment.
Further, GME’s Relative Strength Index (RSI) which measures its overbought and oversold conditions, was in a downtrend at press time. Its value was 56.08.
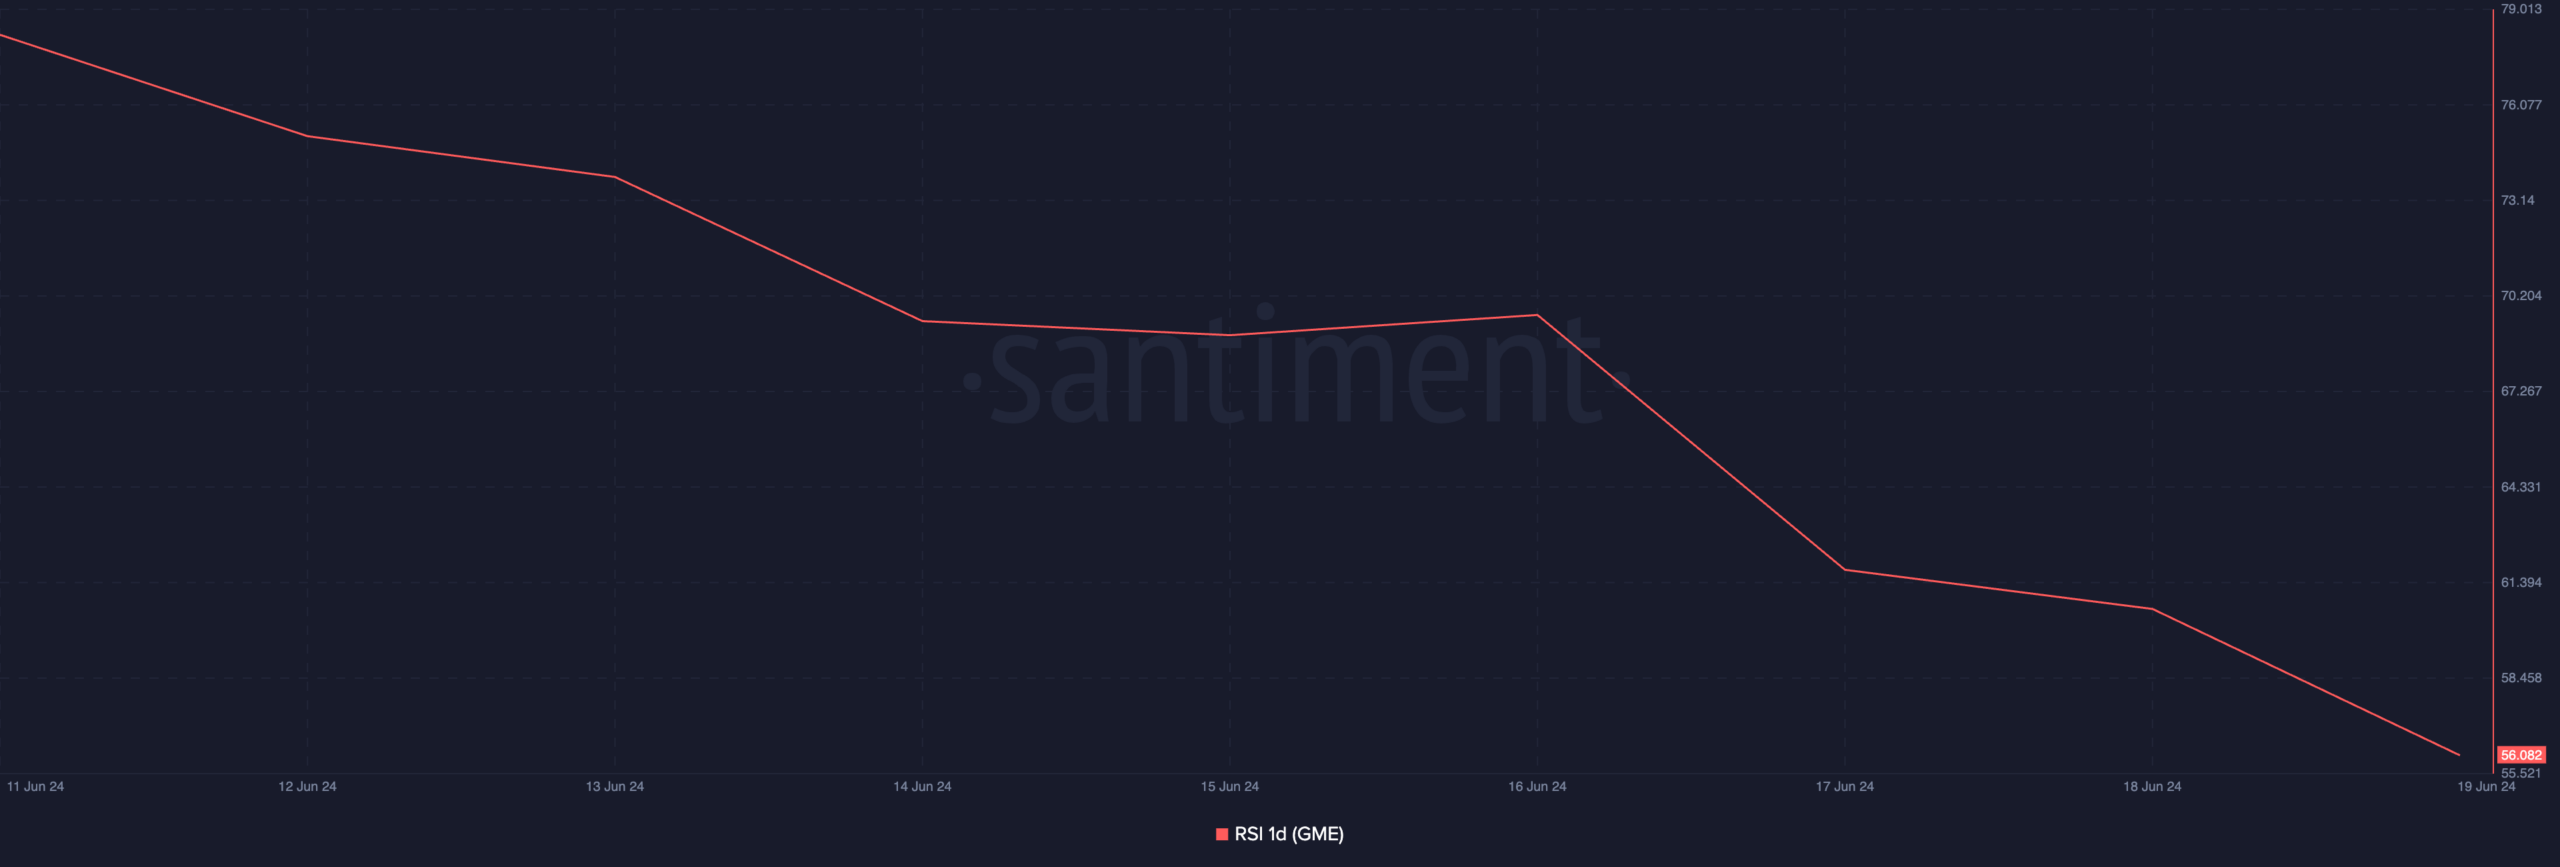
Source: Santiment
At this value, GME’s RSI confirmed the decline in buying activity. The on-chain metric suggested that selling pressure outpaced buying activity among market participants.
Brace for more declines
Readings from GME’s Aroon indicator observed on a daily chart confirmed the strength of the current downtrend. Its Down Line was at 92.86% at the time of writing.
This indicator identifies an asset’s trend strength and potential price reversal points. When the Aroon Down Line is at or near 100%, the downtrend is strong, and the most recent low was reached relatively recently.
Is your portfolio green? Check out the GME Profit Calculator
If selling pressure continues to mount, the token’s price might fall below the $0.008 price level to trade at $0.006.
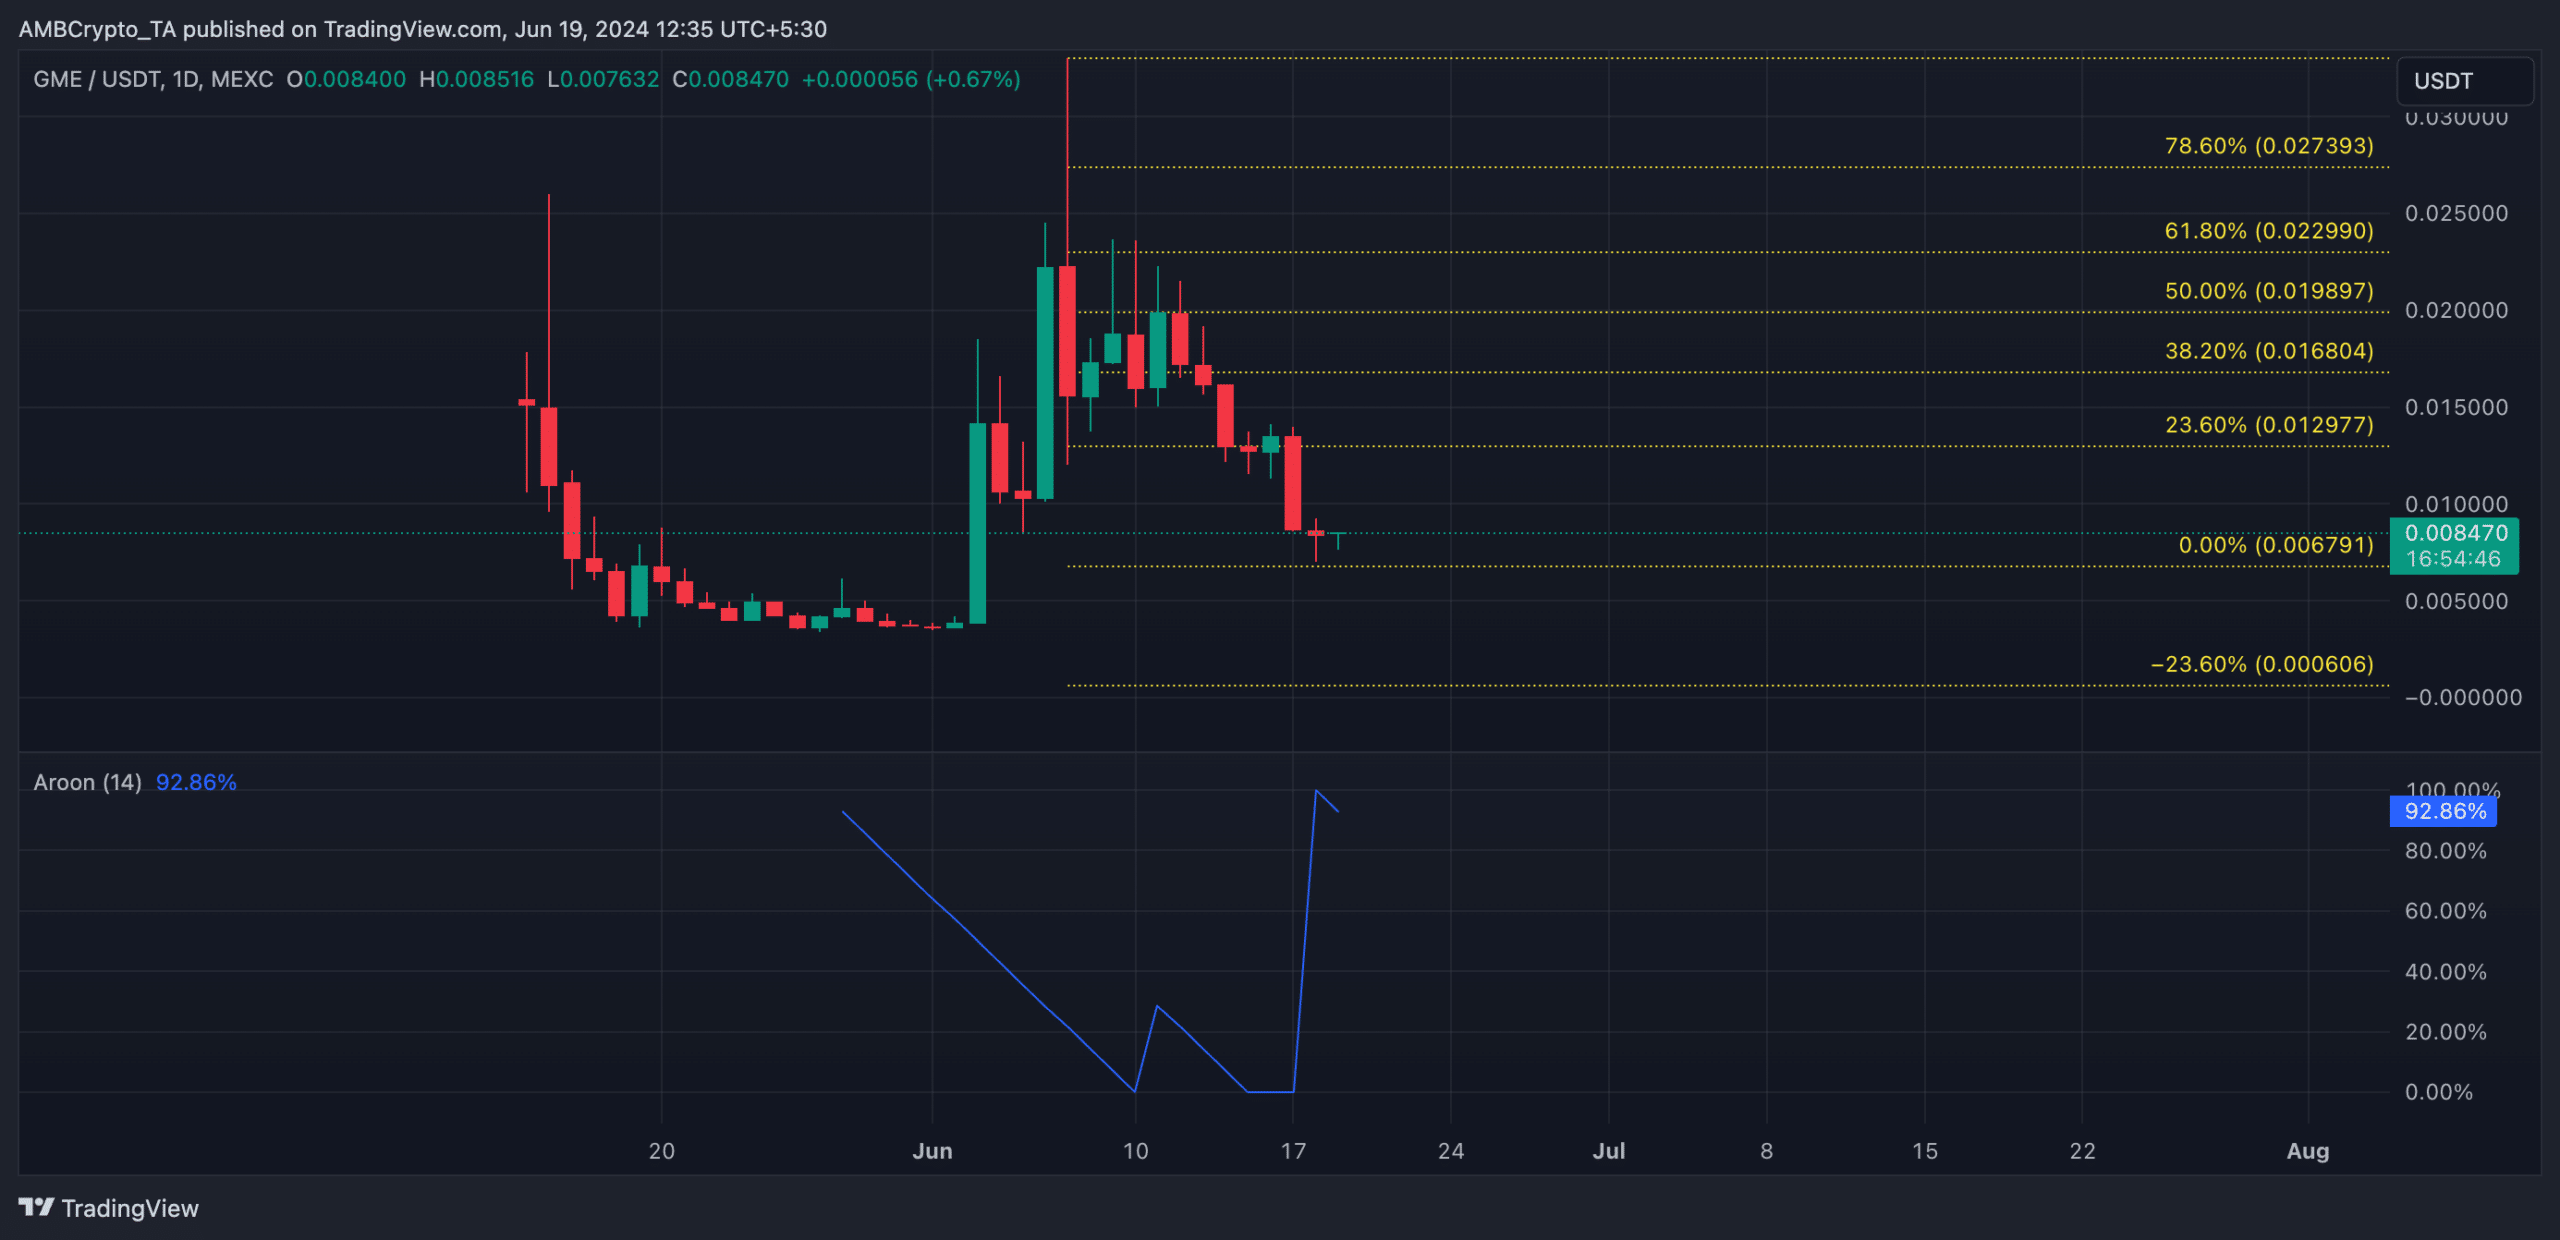
Source: TradingView
However, if the bulls re-emerge and regain market control, they may initiate a rally toward $0.012