
- Ethereum chalked out a classic descending channel pattern on the daily chart, confirming a bearish edge.
- The immediate support range at the $3,200 level can determine ETH’s near-term trajectory.
Ethereum’s [ETH] reversal from the $3,900 resistance level over the past month has set the stage for the bears.
The altcoin’s increasing Open Interest trend during this time has further raised questions about its ability to hold the immediate support level.
Should the sellers continue to increase pressure from its press time level, ETH could invalidate a bullish rally and see a downward breakout. A rebound from the $3,260 level can help the buyers regain some momentum.
At the time of writing, ETH was trading at $3,362, up by nearly 3% in the past 24 hours.
Can ETH bulls reverse the bearish trend?
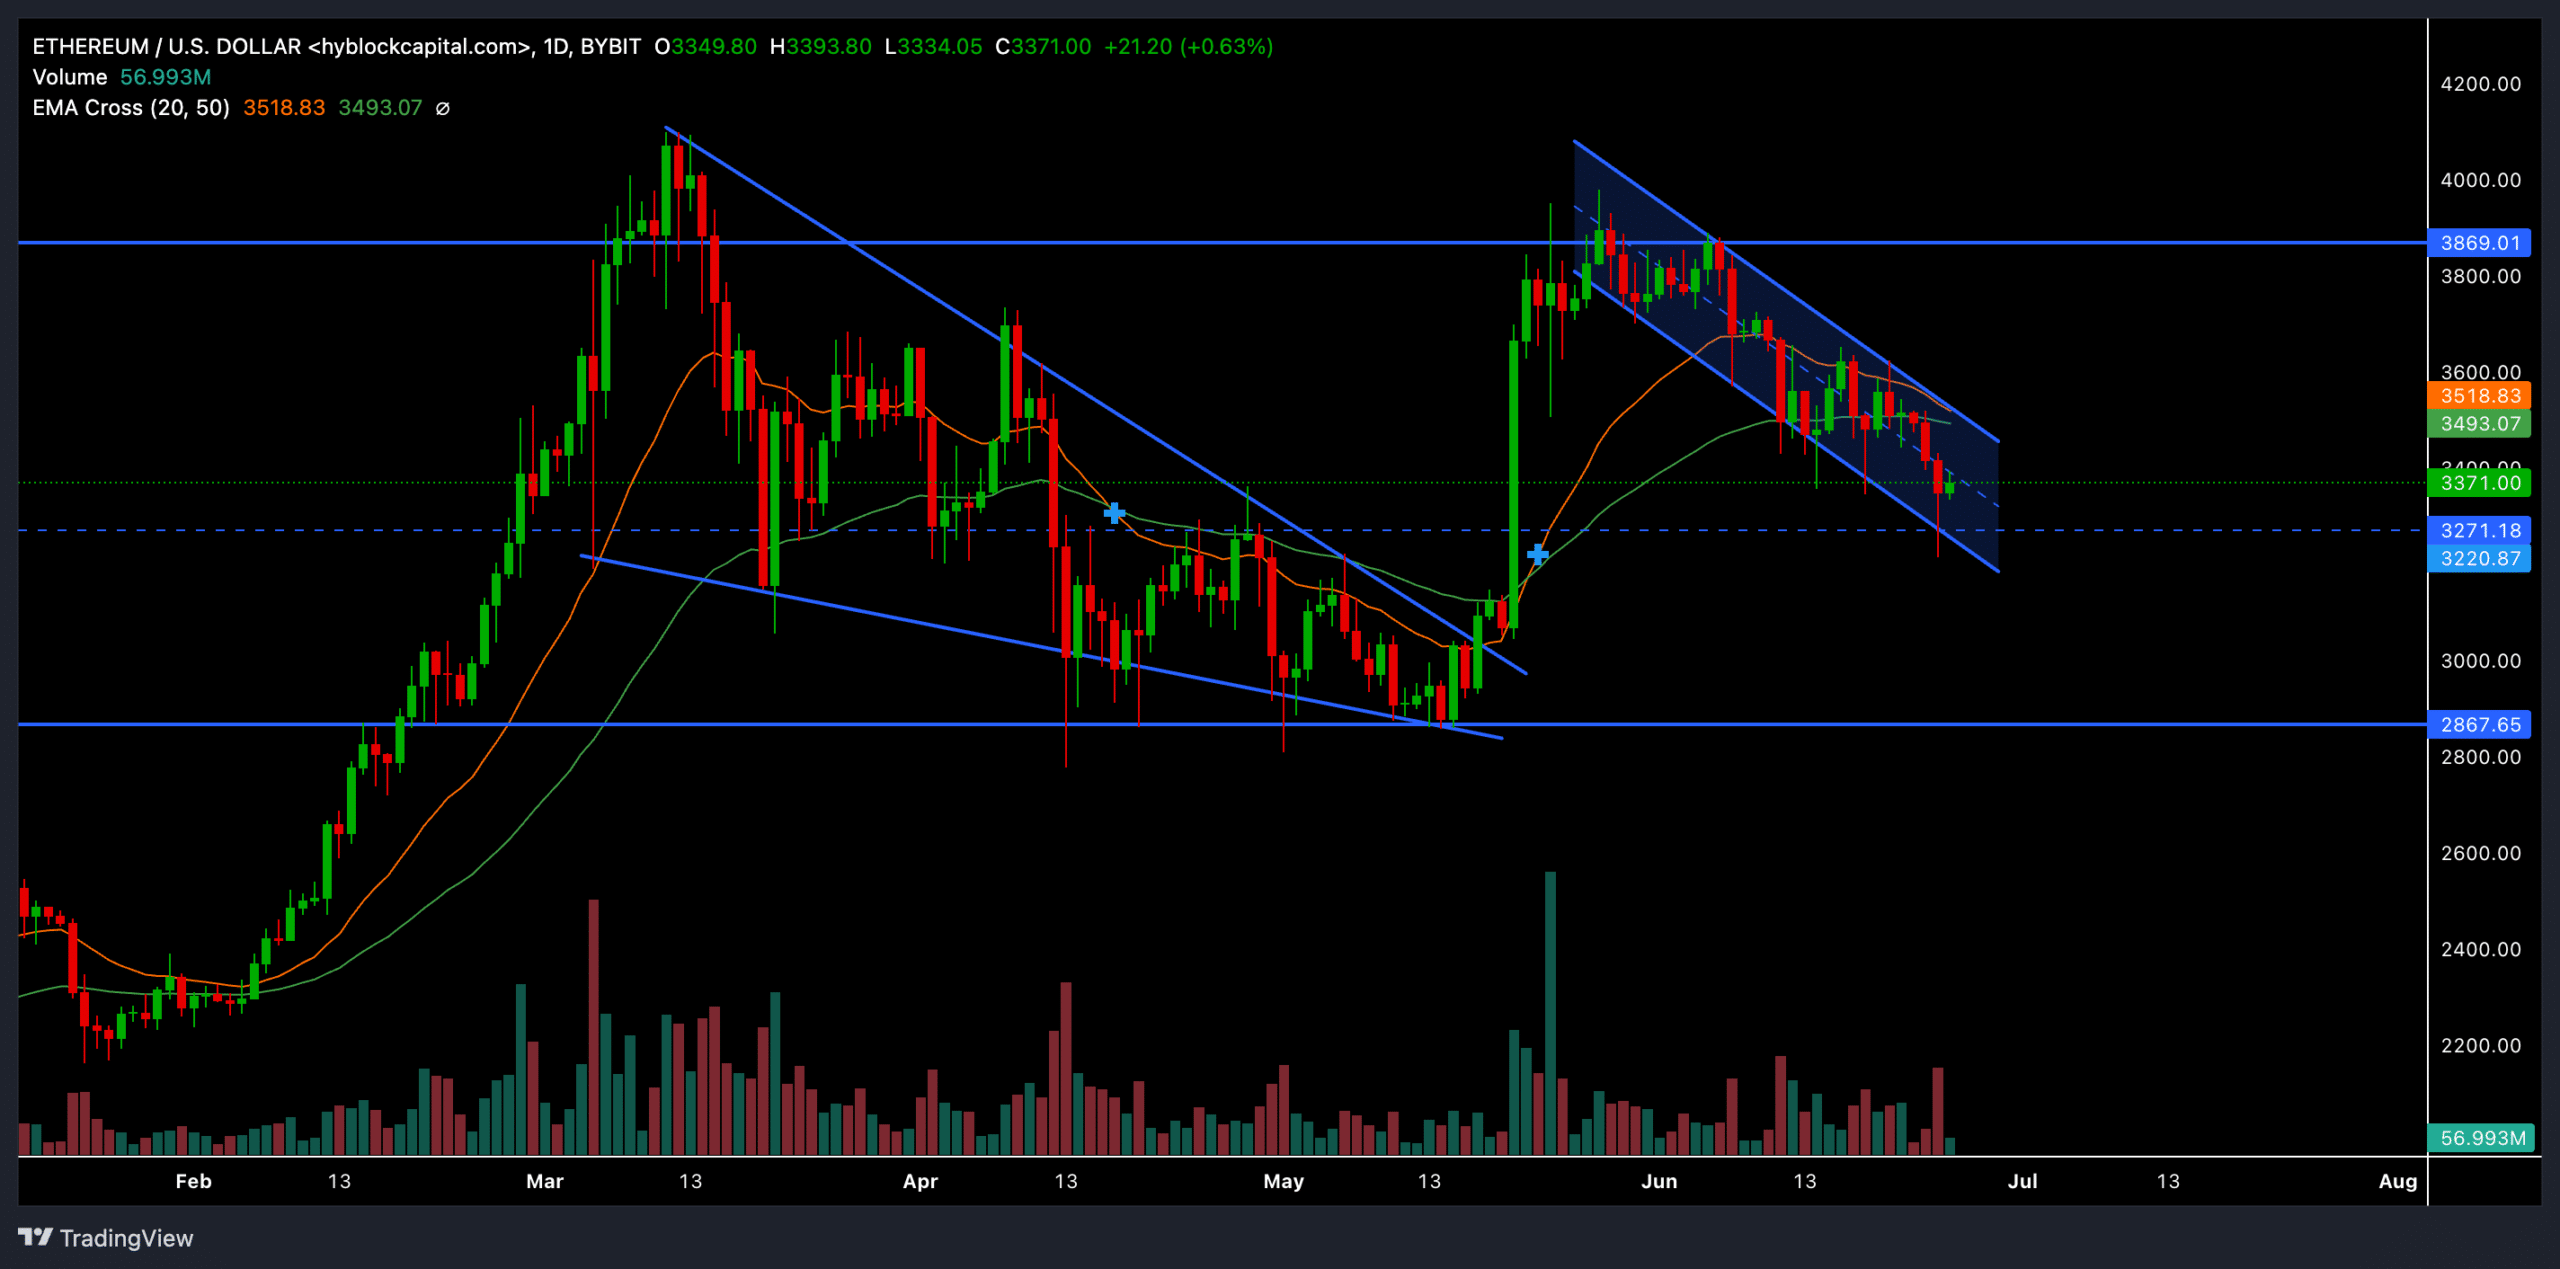
Source: Hyblockcapital, ETH/USD
ETH sellers have consistently held the resistance level near the $4,000 mark as the altcoins for over three months. The $3,900 ceiling blocked ETH’s 35% rally last month and pulled the price below the 20-day and 50-day EMAs.
The resulting price action chalked out a classic descending channel pattern on ETH’s daily chart.
Should the upper trendline of this descending channel continue to resist bull runs, ETH could continue its downtrend in the short term. In this case, the $2,800 region could help provoke a bullish rebound.
On the other hand, a potential close above the current pattern can set the stage for bulls to trigger a rally. In such a case, The first significant resistance level for the buyers would be in the $3,900 region.
The Stochastic RSI showed extremely oversold readings at the time of writing. Buyers should wait for a potential bullish crossover to gauge ETH’s near-term bullish potential.
Price action rising above the 20/50 EMA and a bullish crossover on stochastic RSI together could create a strong buy signal for traders.
Ethereum: Bearish edge emerges

Source: Hyblockcapital, ETH/USD
According to data from Hyperblockcapital, ETH’s Open Interest indicator marked an uptrend (higher highs) over the past month.
Is your portfolio green? Check out the ETH Profit Calculator
However, the price action saw lower highs during this time. This reading typically suggests a bearish divergence– where more traders are entering short positions rather than long positions.
Also, the total net exchange flows over the past day increased by nearly 140% to reaffirm the overall bearish sentiment. ETH’s rebound from the $3.2K–$3.3K support range would be crucial to break the bearish narrative.