Ethereum Classic – Expect this buying opportunity from ETC’s price IF…

- Fibonacci levels and the OBV supported the idea of a bullish ETC
- Liquidity pocket below a key support level could attract prices to it
Ethereum Classic [ETC] saw a strong breakout past the $29-resistance level on 20 May. The subsequent hype around the approval of spot Ethereum [ETH] exchange-traded funds [ETFs] also benefited Ethereum Classic. That’s not all either, with the network seeing its fourth halving on 31 May.
Now, the last ten days have seen some volatility around the $32-level, but ETC shed 8% of its value in just five days. Ergo, the question – Is its next price move set in motion, or was this a healthy pullback before another move higher?
Re-test of a vital ETC support level
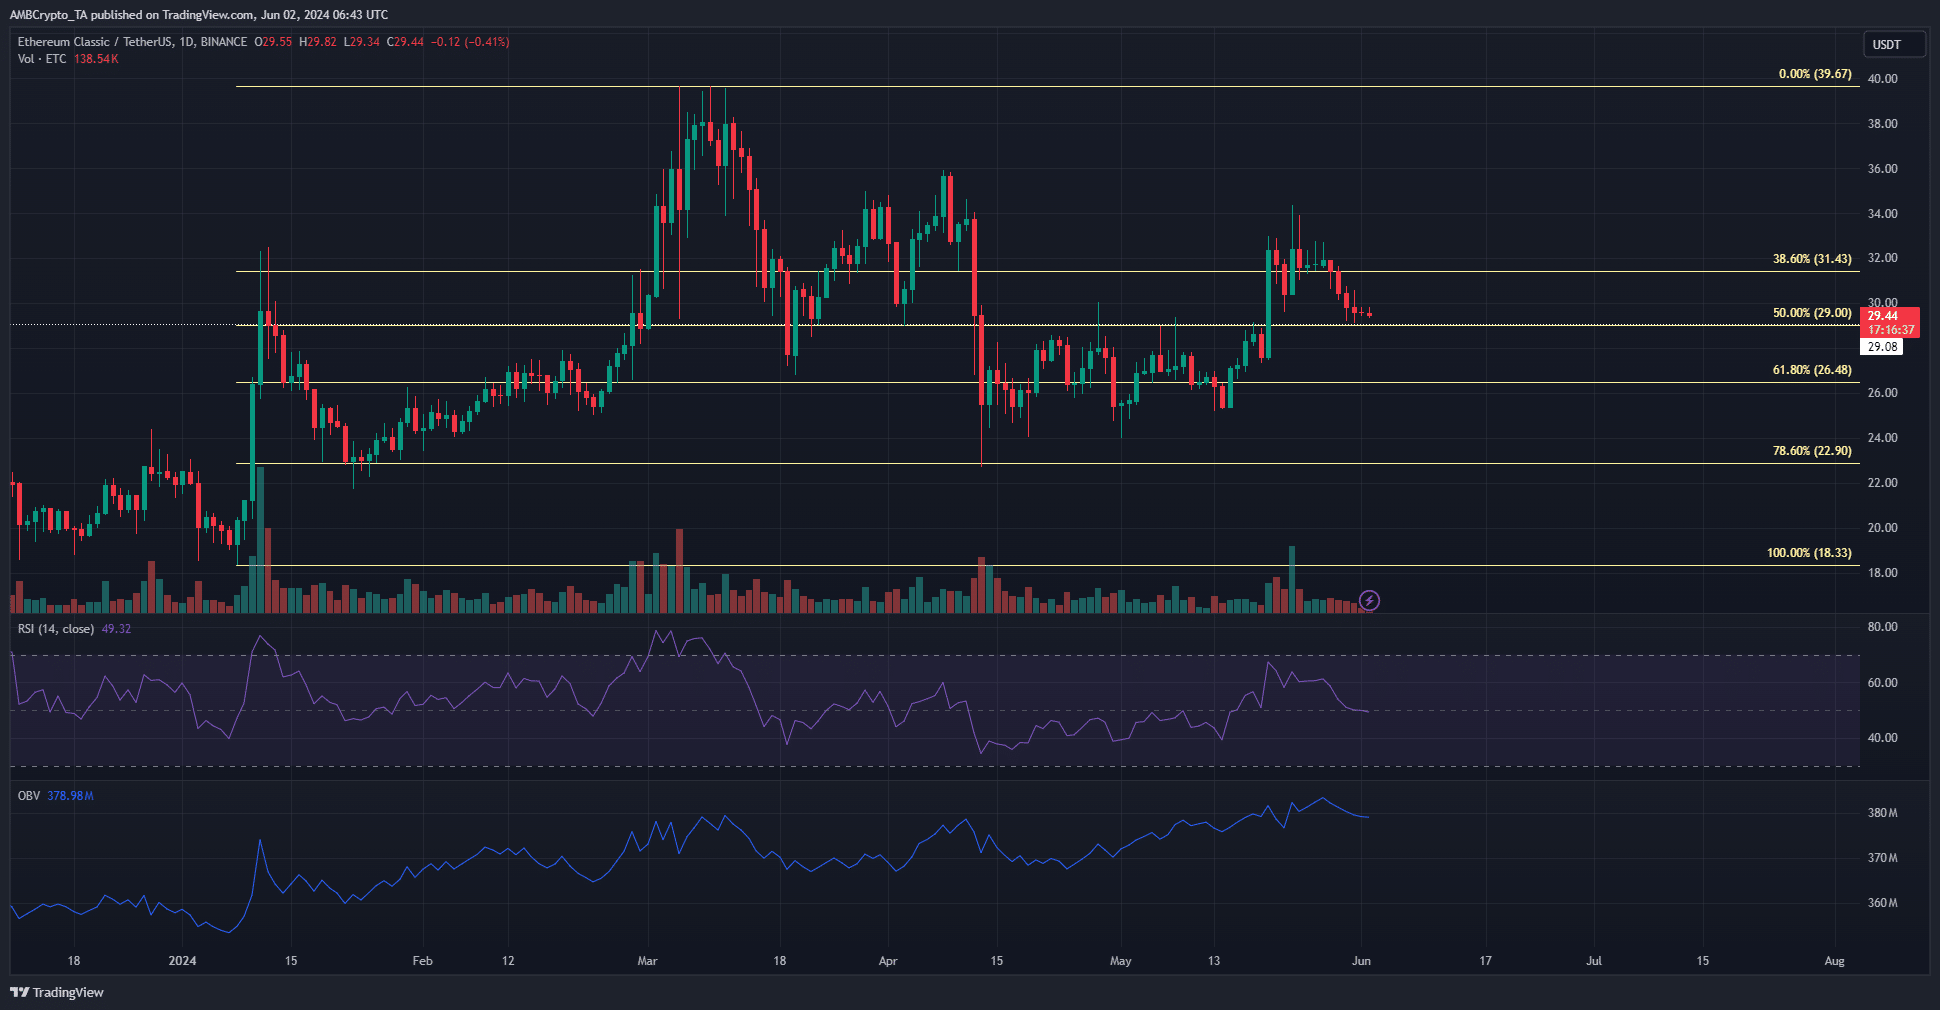
Since 13 April, the $29.1-level has been a stern resistance level for the bulls. They were unable to beat the bears until 20 May. The OBV had been rising for a month by that point and something had to give.
The breakout strength was also aided by the hype around Ethereum, which invariably has a positive effect on ETC as well. Since then, the momentum has slowed down. This was seen by the RSI’s drop to 49.
Ethereum Classic retested the $29 former resistance level as support and is expected to react positively. However, some lower timeframe volatility could develop on Monday.
Based on its early 2024 rally, the retracement in March and April did not fall under the 78.6% level at $22.5. At press time, the 50% level at $29 was the support, which suggested that a move towards its $39.7 high could follow in the coming weeks.
Liquidity pocket below $29 as a magnetic zone

Source: Hyblock
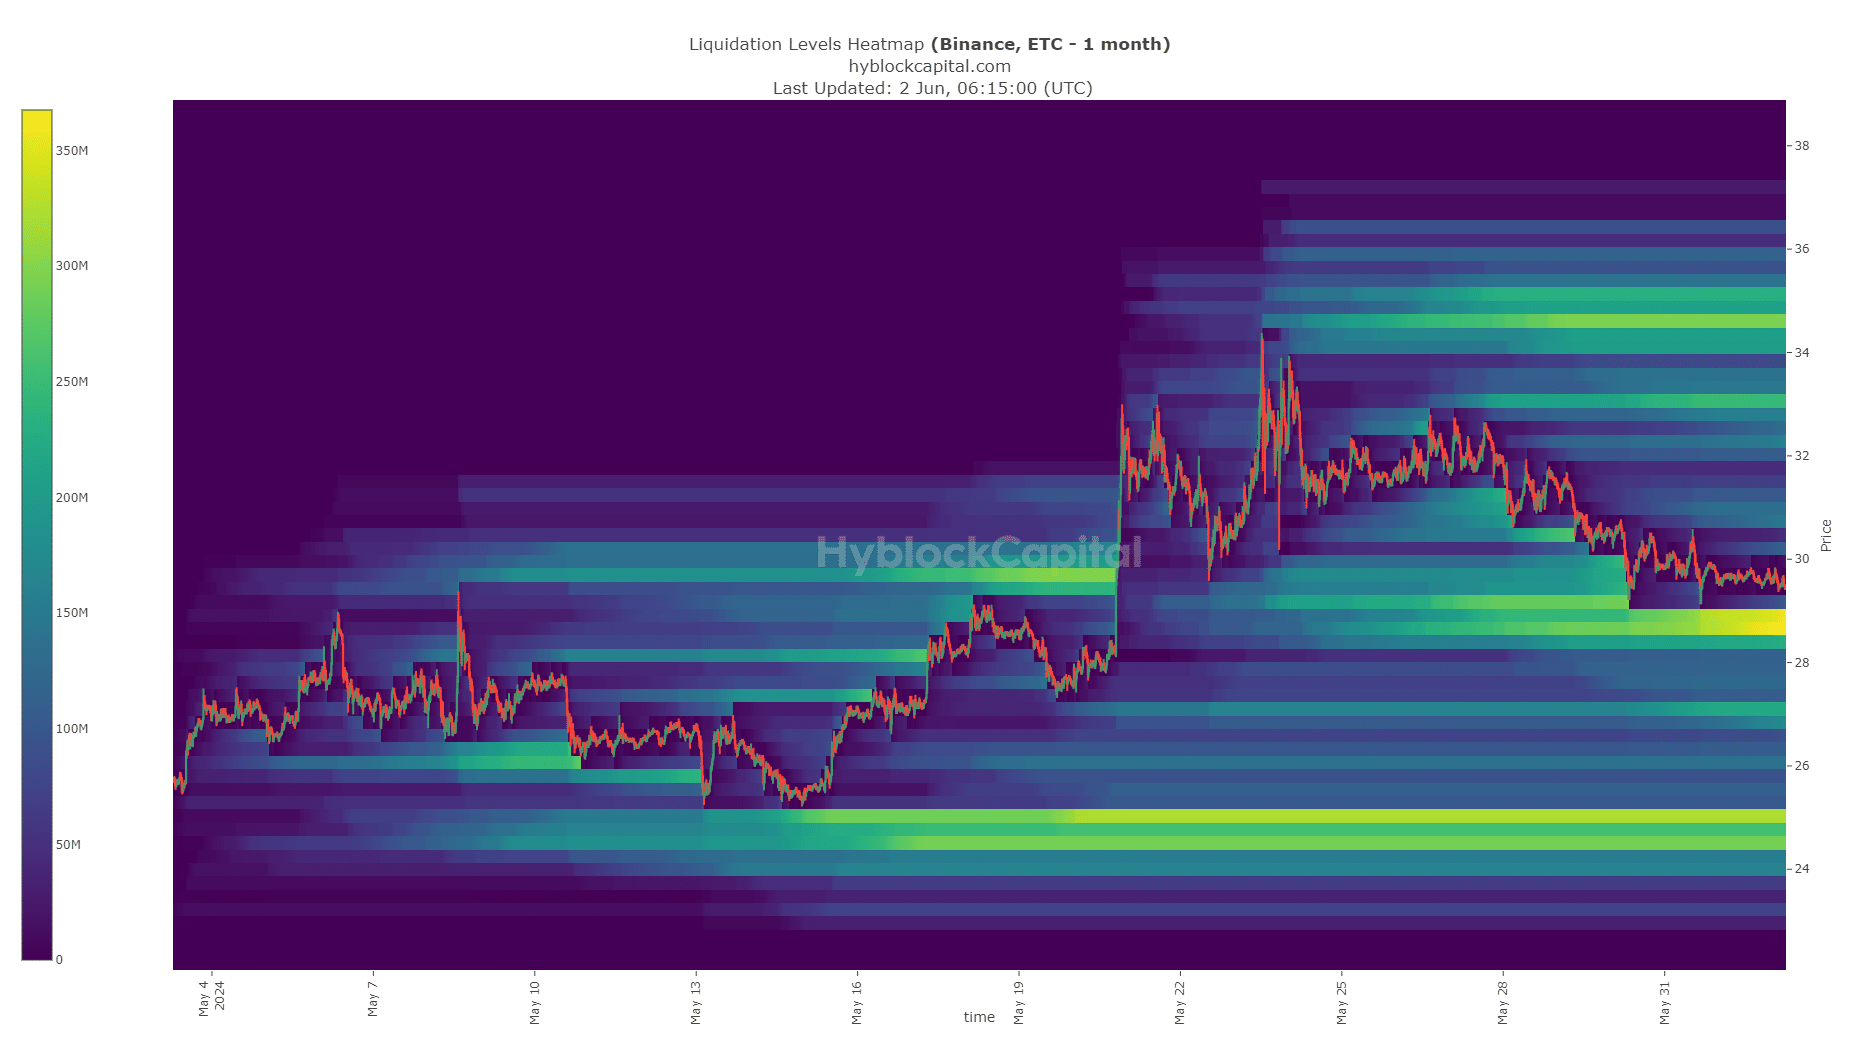
Though the $29-level would likely see a bounce, it might come after a sweep of the $28.4-level. The one-month look back liquidation levels heatmap revealed that the $28.4-$29 zone was filled with short liquidations.
Is your portfolio green? Check the Ethereum Classic Profit Calculator
A move into this zone would collect the liquidity present here before the next rally. Hence, traders should use a drop towards $28 as a buying opportunity based on the evidence at hand.
Disclaimer: The information presented does not constitute financial, investment, trading, or other types of advice and is solely the writer’s opinion.


