![Chainlink [LINK] turns bullish: Rally ahead, or simply a spike?](https://stage.ambcrypto.com/wp-content/uploads/2024/07/Chainlink-is-back-on-track-1200x686.webp)
- LINK’s price surged by 4% in the last 24 hours.
- A few metrics looked bullish, but the rest suggested otherwise.
Chainlink [LINK], like several other cryptos, faced bears’ wrath last week as its price charts turned red. Per latest data, the token might be testing the support of a bearish pattern.
However, the current market trend has changed.
Chainlink bulls make an entry
AMBCrypto had earlier reported that a sell signal appeared on the token’s 4-hour chart. There was a possibility of LINK registering a few more red candlesticks on its 4-hour chart on the 7th of July.
Also, Ali, a popular crypto analyst, recently posted a tweet revealing that a head-and-shoulder pattern emerged on LINK’s daily chart.
The token was testing the support of the pattern at the time of the tweet, and a plummet under it could result in LINK dipping to $7.

Source: X
Thankfully, Chainlink bulls took over the market, as LINK successfully tested the support at press time. According to CoinMarketCap, LINK was up by more than 4% in the last 24 hours.
The token was trading at $13.38 with a market capitalization of over $8.138 billion, making it the 15th largest crypto.
However, it was surprising to note that, despite the latest price uptick, market sentiment around had remained bearish. This was evident from the drop in its Weighted Sentiment.
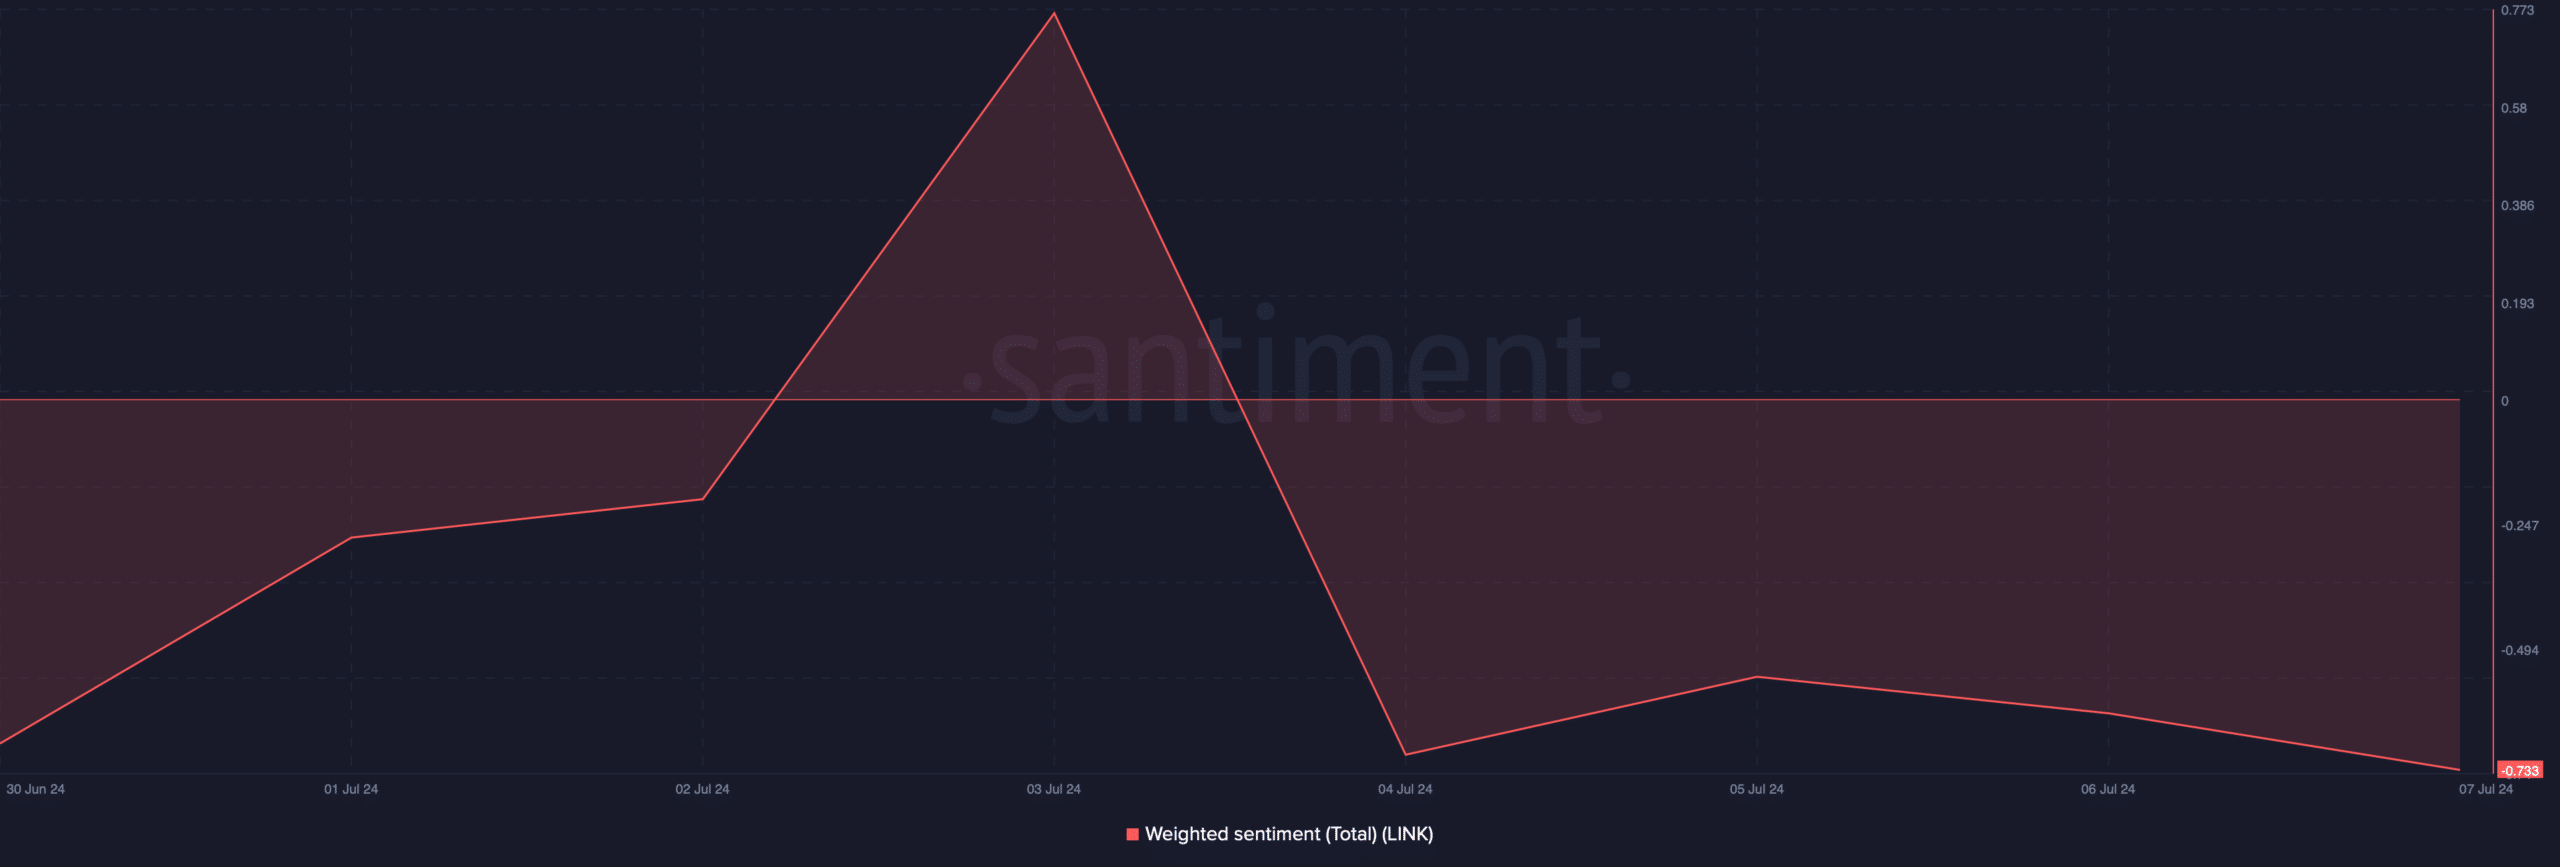
Source: Santiment
Will LINK’s bully rally last?
Since market sentiment looked bearish, AMBCrypto checked other on-chain data to find out the odds of LINK sustaining its recently gained upward momentum.
We found that LINK’s Supply on Exchanges dropped sharply last week. This meant that buying pressure on the token was high. Additionally, Chainlink’s NVT Ratio dropped substantially.
Generally, a drop in the metric means that an asset is undervalued, which indicates that the chances of a price rise were high.
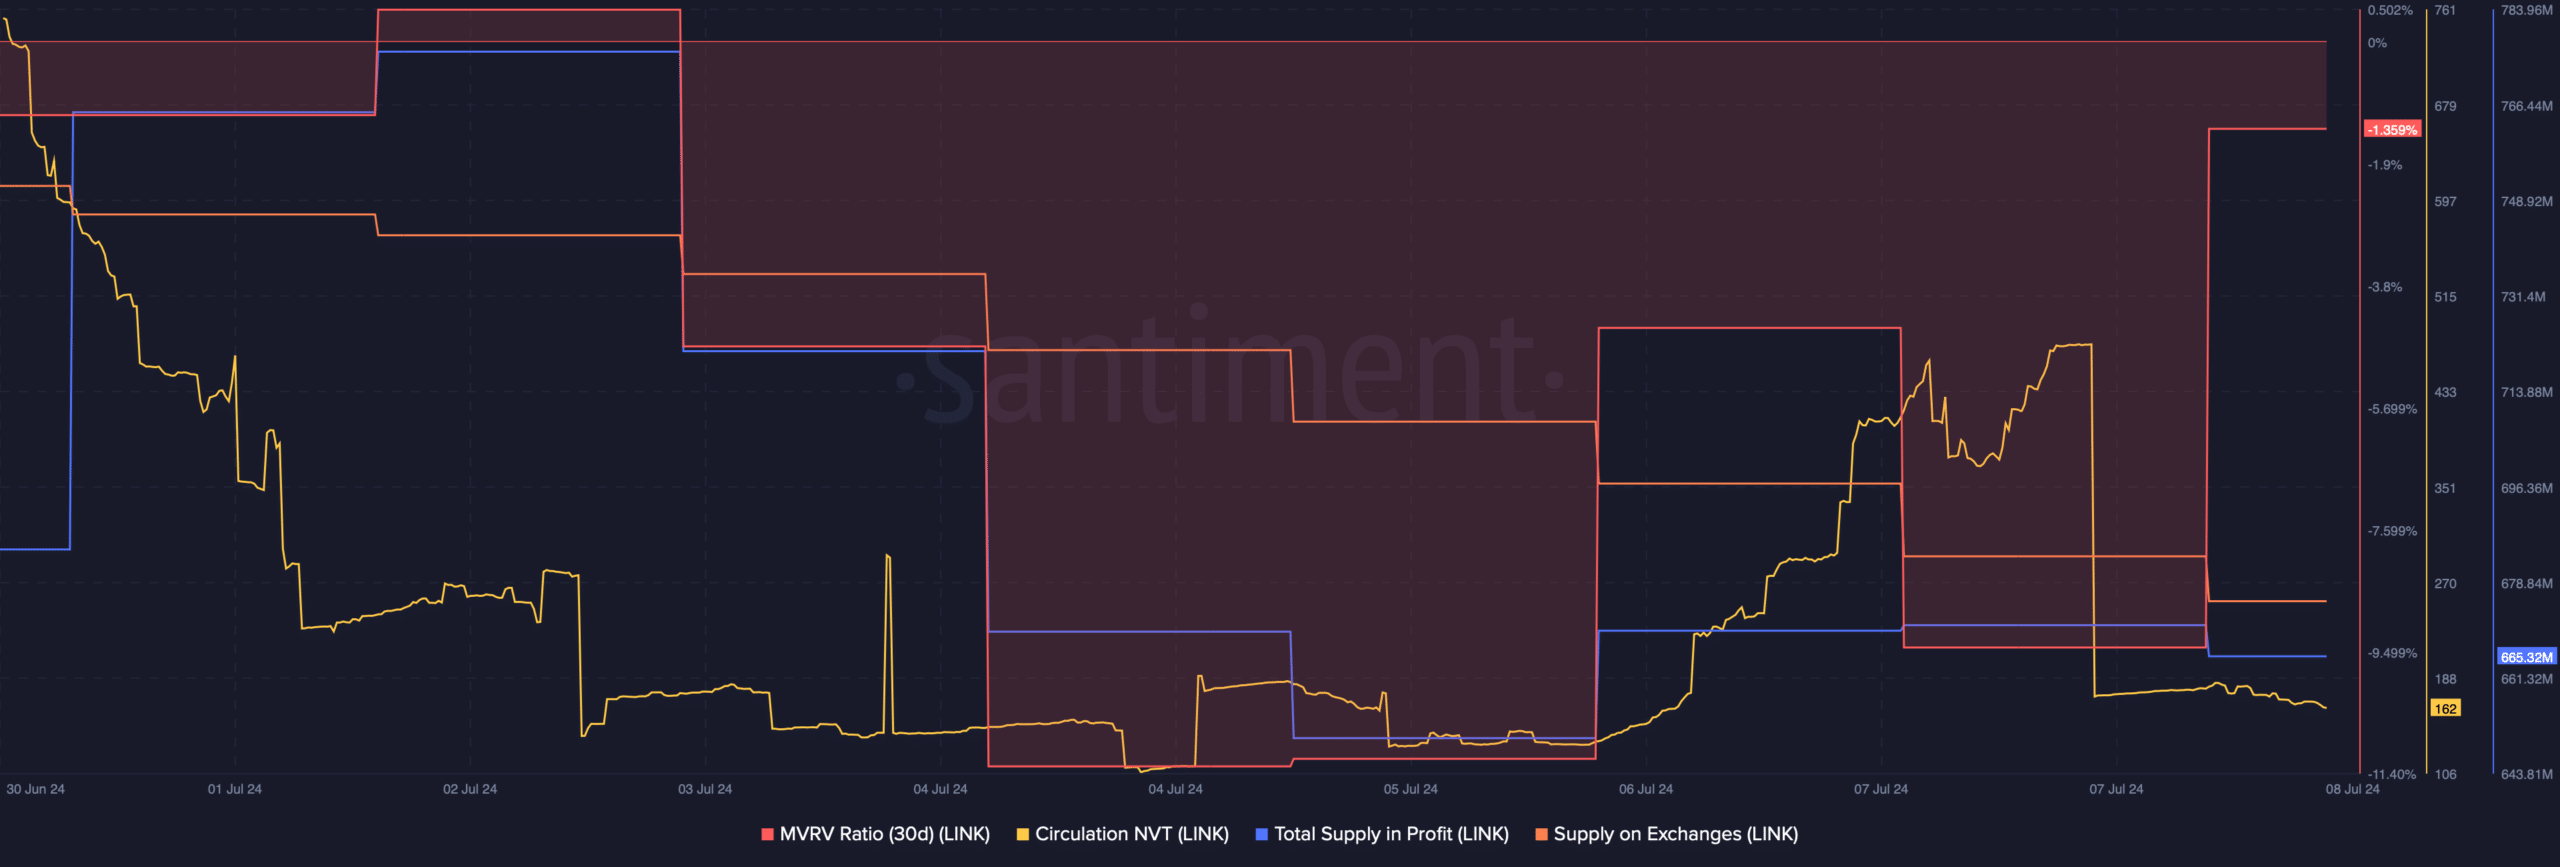
Source: Santiment
However, not everything was in LINK’s favor. For example, the token’s MVRV ratio dropped, which can be inferred as a bearish signal. Interestingly, though LINK’s price increased, its Total Supply in Profit remained low.
We then took a look at LINK’s daily chart to better understand what to expect. As per the MACD, the bulls and the bears were competing to gain an advantage over each other.
Realistic or not, here’s LINK’s market cap in BTC’s terms
On one hand, the Money Flow Index (MFI) moved northward and was headed towards the neutral mark, indicating that the bulls would turn out to be victorious.
On the other hand, the Chaikin Money Flow (CMF) registered a downtick, which suggested that LINK’s bull rally might not last.
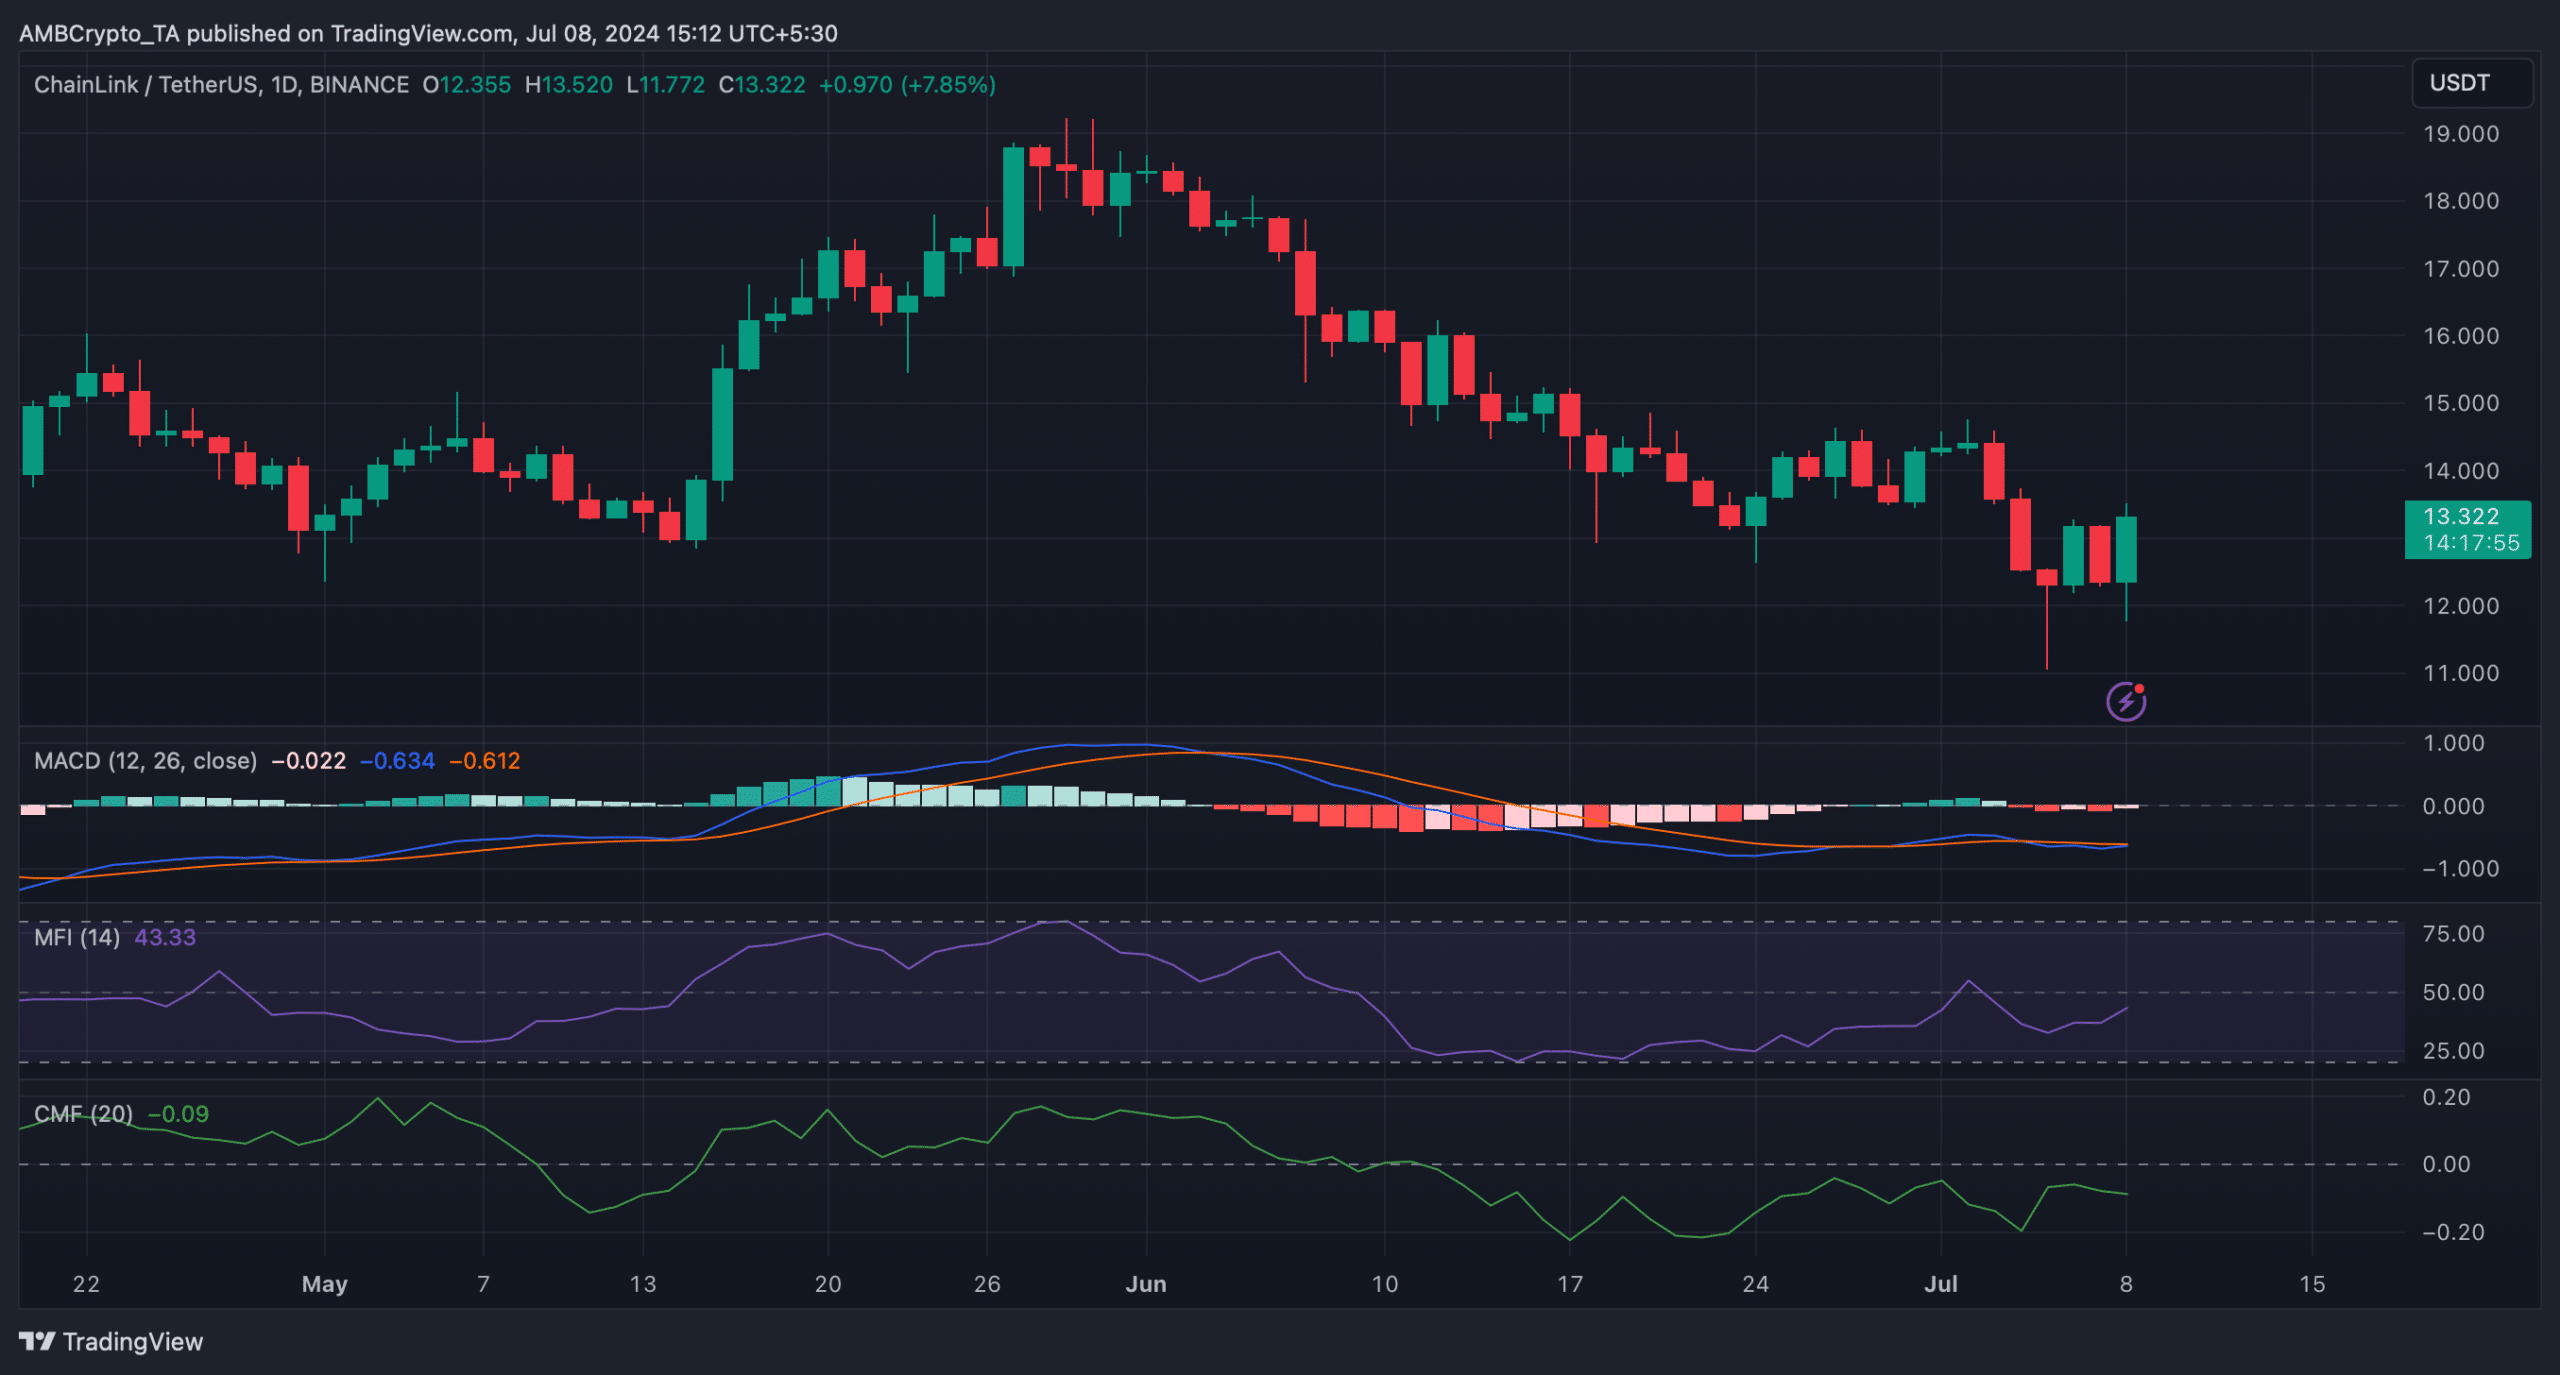
Source: TradingView