Bitcoin’s MVRV ratio tests crucial support – Here’s why it matters

- BTC was trading at around $57,000 with a slight gain.
- Long-term holders were still able to hold at a profit despite the initial scare.
Recently, Bitcoin [BTC] experienced a significant dip, reaching a level that nearly positioned long-time holders at the brink of non-profitability.
This situation highlights the importance of the current Bitcoin’s Market Value to Realized Value (MVRV) ratio, which is a critical support line for Bitcoin’s price. If this support line is breached, the market could react in several ways.
Bitcoin ratio tests support
A recent post by Santiment provided insights into the current state of the Bitcoin ratio. The post highlighted the MVRV ratio, focusing on 30-day and 365-day metrics. This analysis is critical in assessing the immediate and longer-term financial stance of Bitcoin holders.
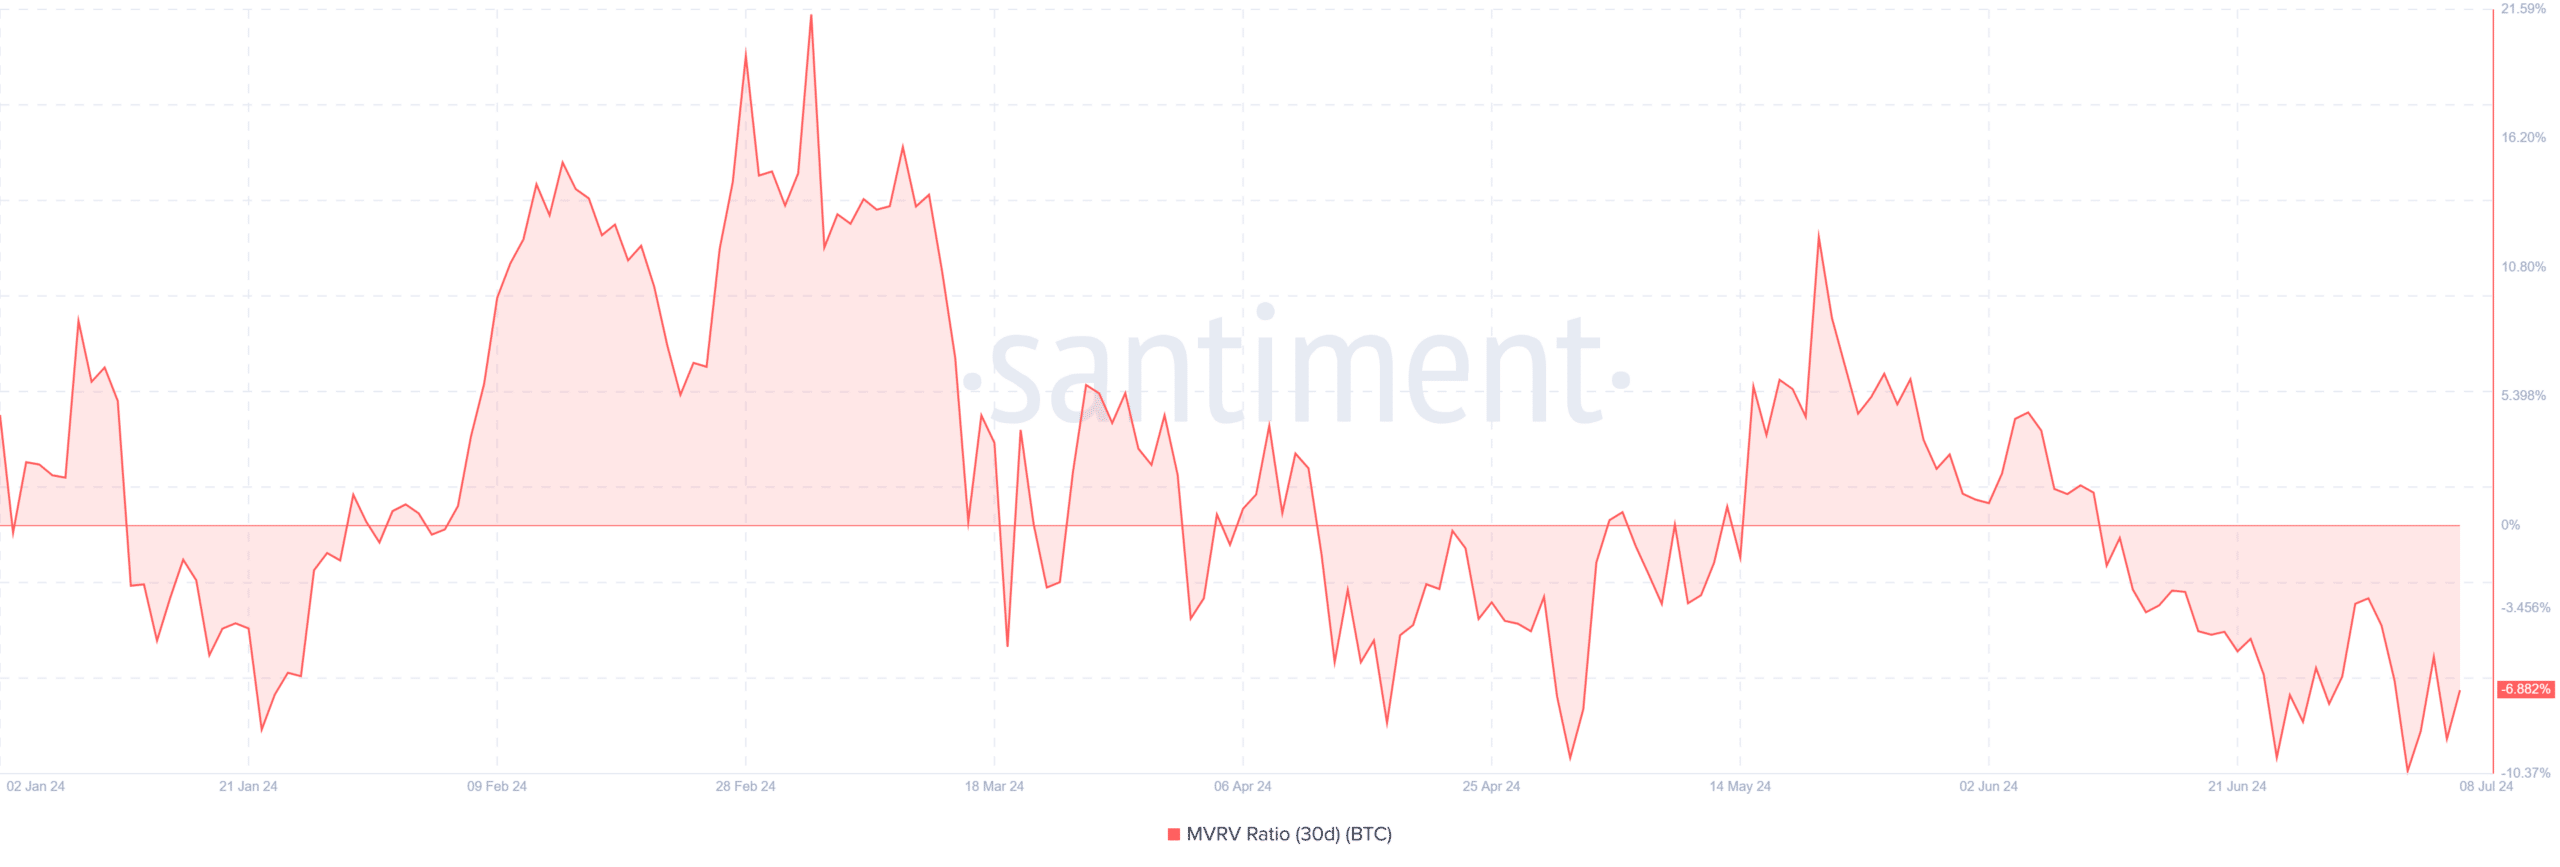
The 30-day MVRV ratio, which assesses the profit or loss status of those who have bought BTC in the last month, has recently dipped below zero.
This decline began around 11th June, and the ratio has worsened to approximately -6.8%. This indicates that holders who have acquired Bitcoin during this period are, on average, experiencing a loss exceeding 6%.
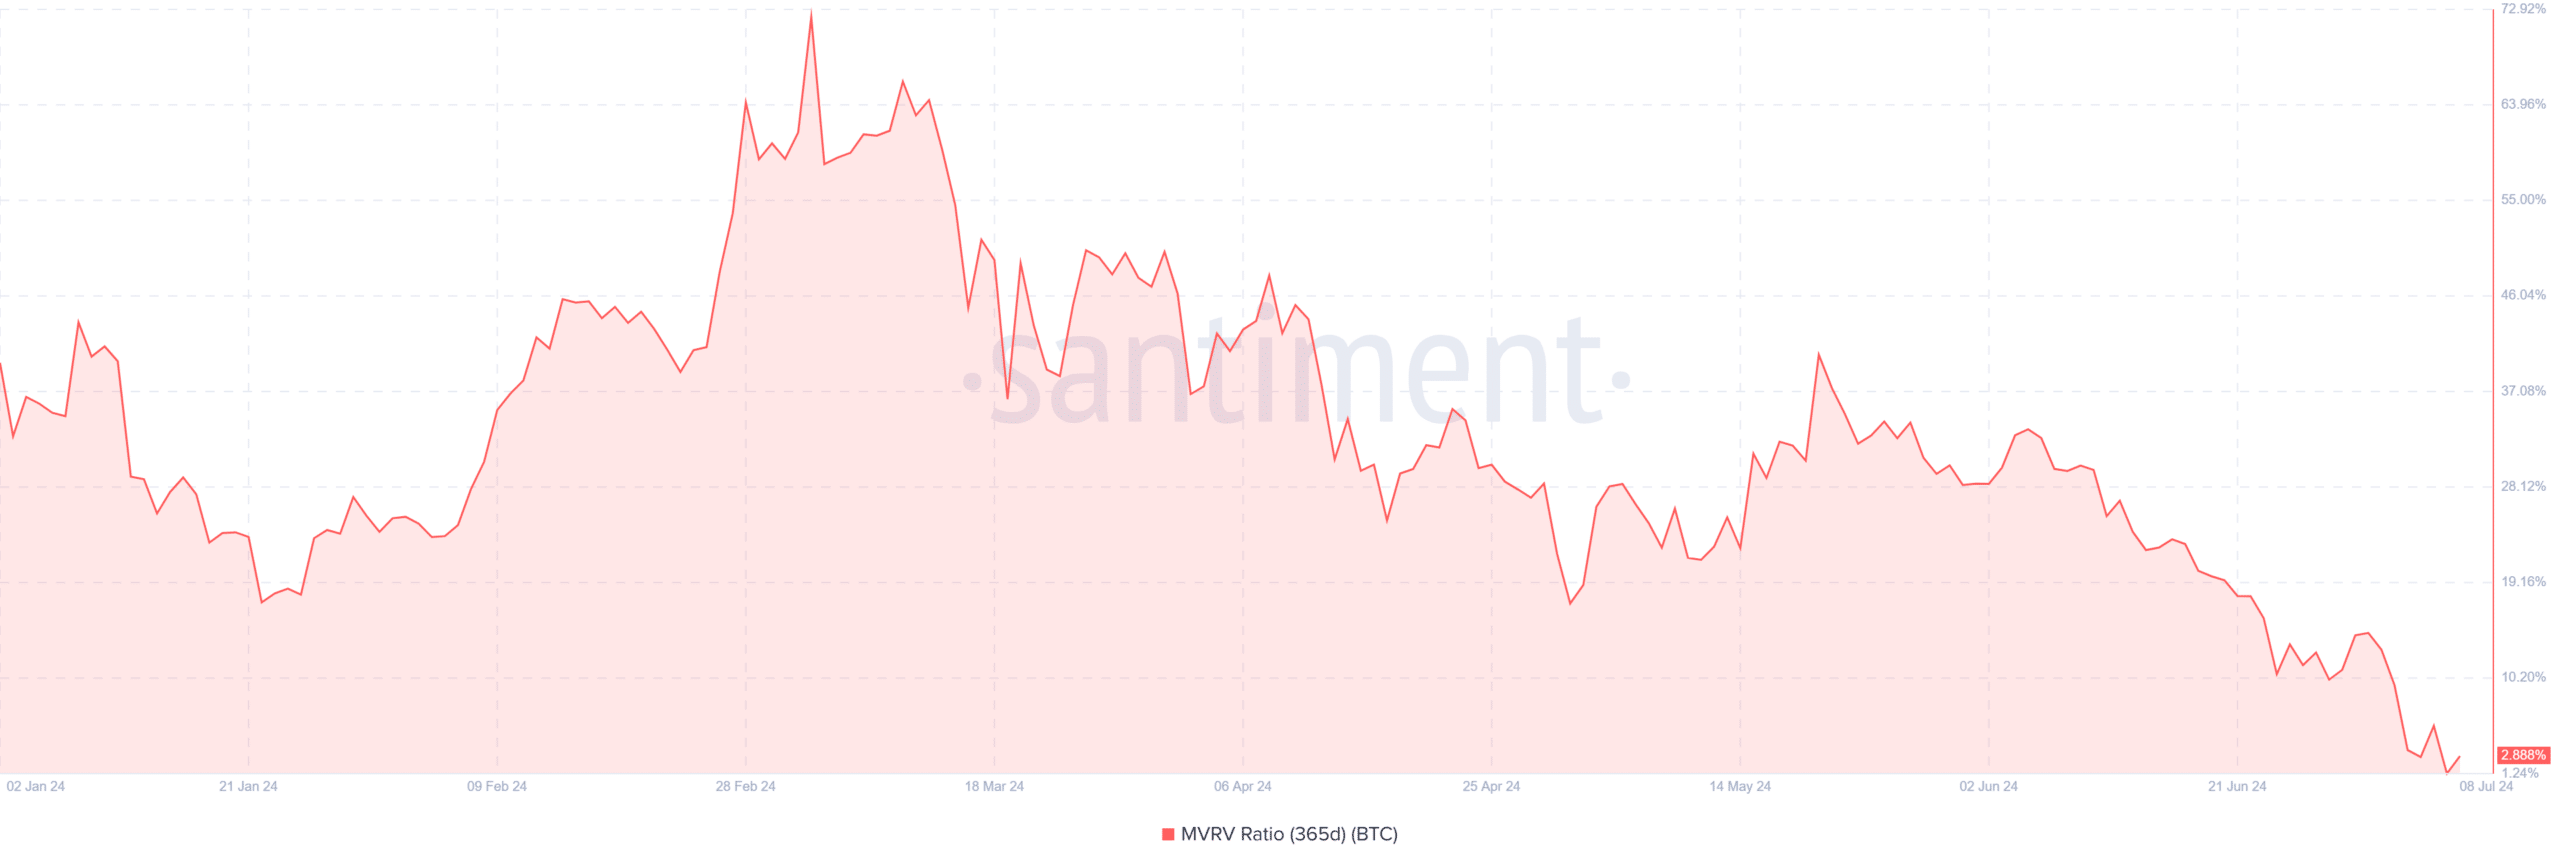
Additionally, on a broader scale, the 365-day MVRV ratio, which reflects the market behavior of long-term holders, showed these investors were nearing a crucial threshold.
Over time, this ratio has remained above zero, suggesting that long-term holders have maintained a profitable position.
However, recent data reveals a concerning trend: just a few days ago, the ratio fell to about 1.25%, marking its lowest point in months, and as of the last report on 8th July, it hovered around 2.8%.
How the market could react
This proximity of the long-term MVRV ratio to the breakeven point is significant because it acts as a support level.
If this Bitcoin ratio fell below zero, it could signal a shift in sentiment among long-term holders. It could increase selling pressure as these investors seek to cut losses or capitalize on remaining gains.
Also, this could exacerbate the downward pressure on BTC’s price. Conversely, if the support holds, it could bolster confidence among investors. It could stabilize the price or even drive recovery.
The market’s response to this pivotal point will be crucial in determining BTC’s short to medium-term price trajectory.
The current trend of BTC
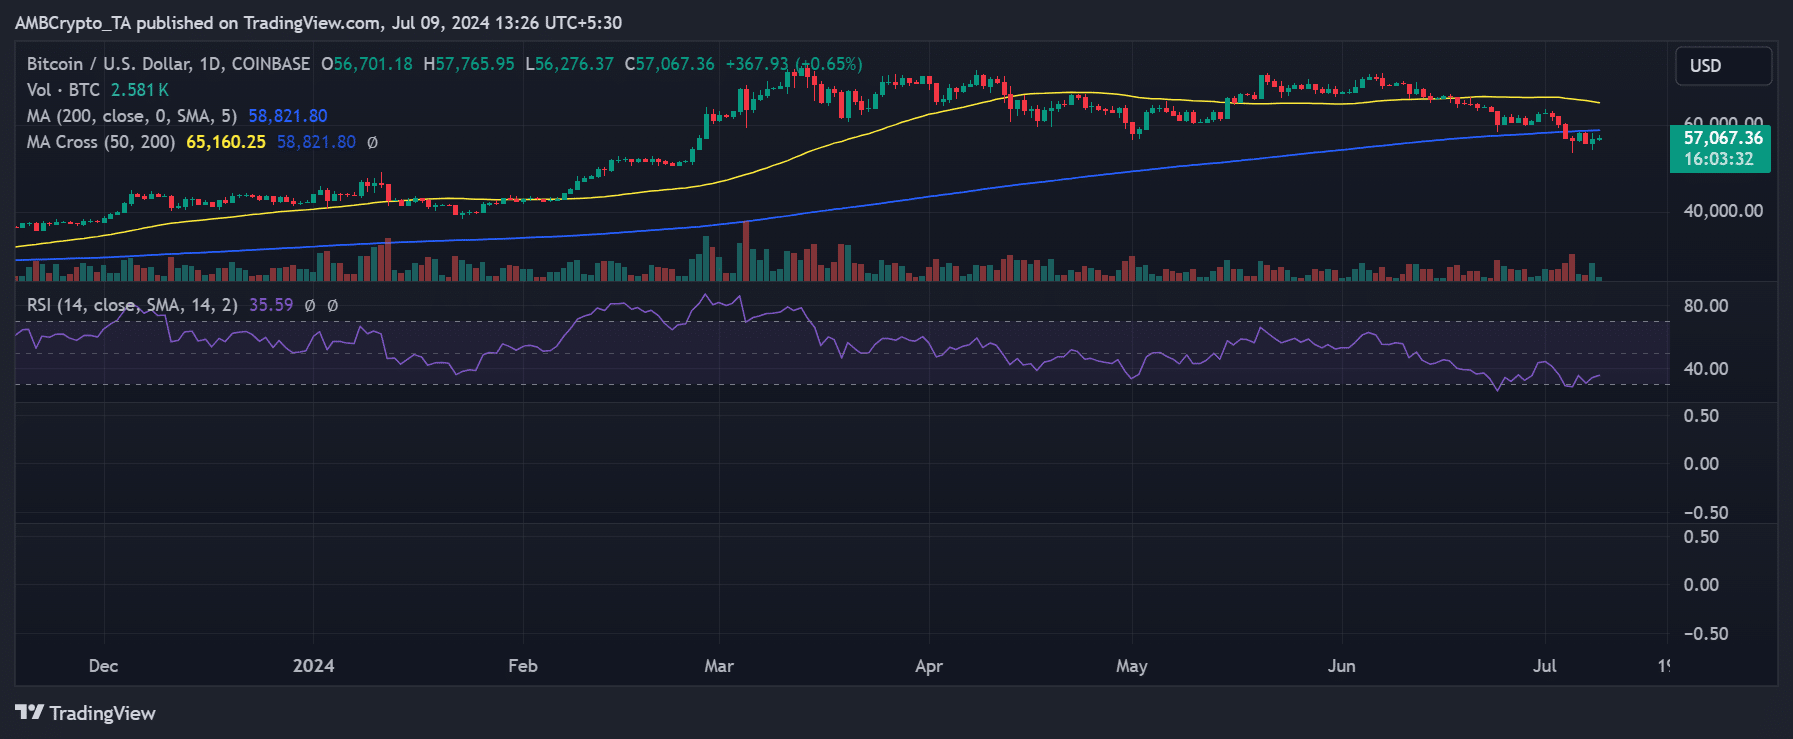
The analysis of Bitcoin on a daily time frame chart provides a nuanced view of its recent market movements. BTC initially experienced a notable decline in the previous trading session, hitting a low of approximately $54,278.
This downturn briefly heightened concerns regarding the potential for breaking key support levels within the Bitcoin MVRV ratio—a metric closely watched for signs of market stability or stress.
Read Bitcoin (BTC) Price Prediction 2024-25
Despite the decline in early sessions, the session ended with an increase of over 1%. Also, as of this writing, it was trading at over $57,000, increasing around 0.6%.


