- After a 20% monthly fall, BTC’s price appreciated by 2% in the last 24 hours
- Most metrics suggested that BTC would remain bullish in the short-term
Bitcoin’s [BTC] price has been falling on the charts for several weeks now. 6 July was an exception though, with the crypto managing to stay green.
However, its insignificant 24-hour recovery was not comparable with cryptos that registered double-digit percentage hikes over the last 24 hours. That being said, the world’s largest cryptocurrency might soon turn a corner.
Bitcoin turns green
The past month was somewhat of a bloodbath for the king of cryptos as its price declined by nearly 20%. A similar declining trend was also seen last week. While the last 24 hours have brought better news for Bitcoin holders, the crypto is still far from hitting its former highs, with BTC trading just under $57k at press time.
AMBCrypto’s look at CryptoQuant’s data revealed that BTC’s exchange reserves rose last month, meaning that investors were selling their holdings. Additionally, BTC’s accumulation trend score remained somewhere in the range of 0.16–0.11. Ordinarily, the closer the metric is to 1, the greater the buying pressure.
Here, it’s worth pointing out that the Accumulation Trend Score is an indicator that reflects the relative size of entities that are actively accumulating coins on-chain, in terms of their BTC holdings.
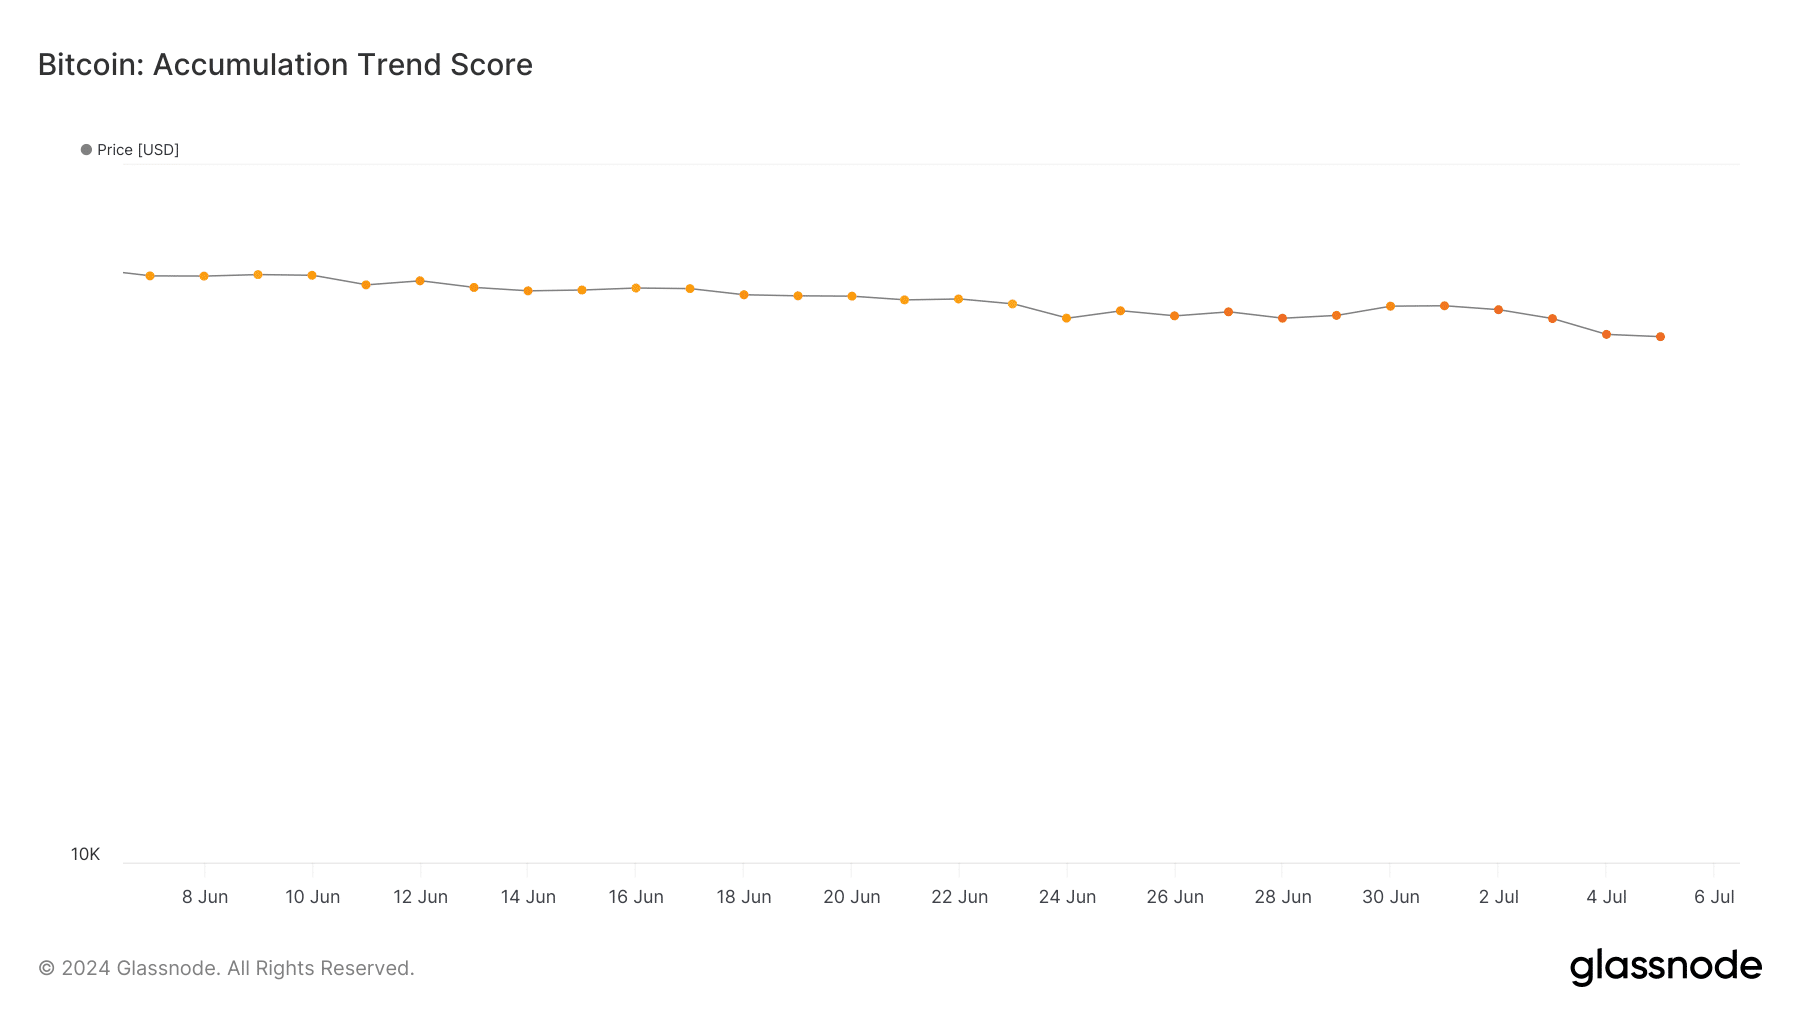
Source: Glassnode
Will BTC recover anytime soon?
While that happened, Captain Faibik, a popular crypto analyst, shared a tweet revealing a possible reason behind BTC’s fall on the charts.
As per the analyst’s findings, BTC’s price has been consolidating inside a widening, falling wedge pattern. The tweet also mentioned that Bitcoin bulls need to clear the $61k resistance area to regain bullish momentum.

Source: X
Additionally, AMBCrypto’s analysis of BTC’s Pi Cycle Top indicator highlighted that the crypto has been resting under its possible market bottom for quite some time now.
As per the same, BTC’s possible market bottom and tops were $65k and $93k, respectively. Moreover, BTC’s fear and greed index showed that it had a value of 23, meaning that the market was in a “fear” phase. Whenever that happens, the chance of a price hike are high.
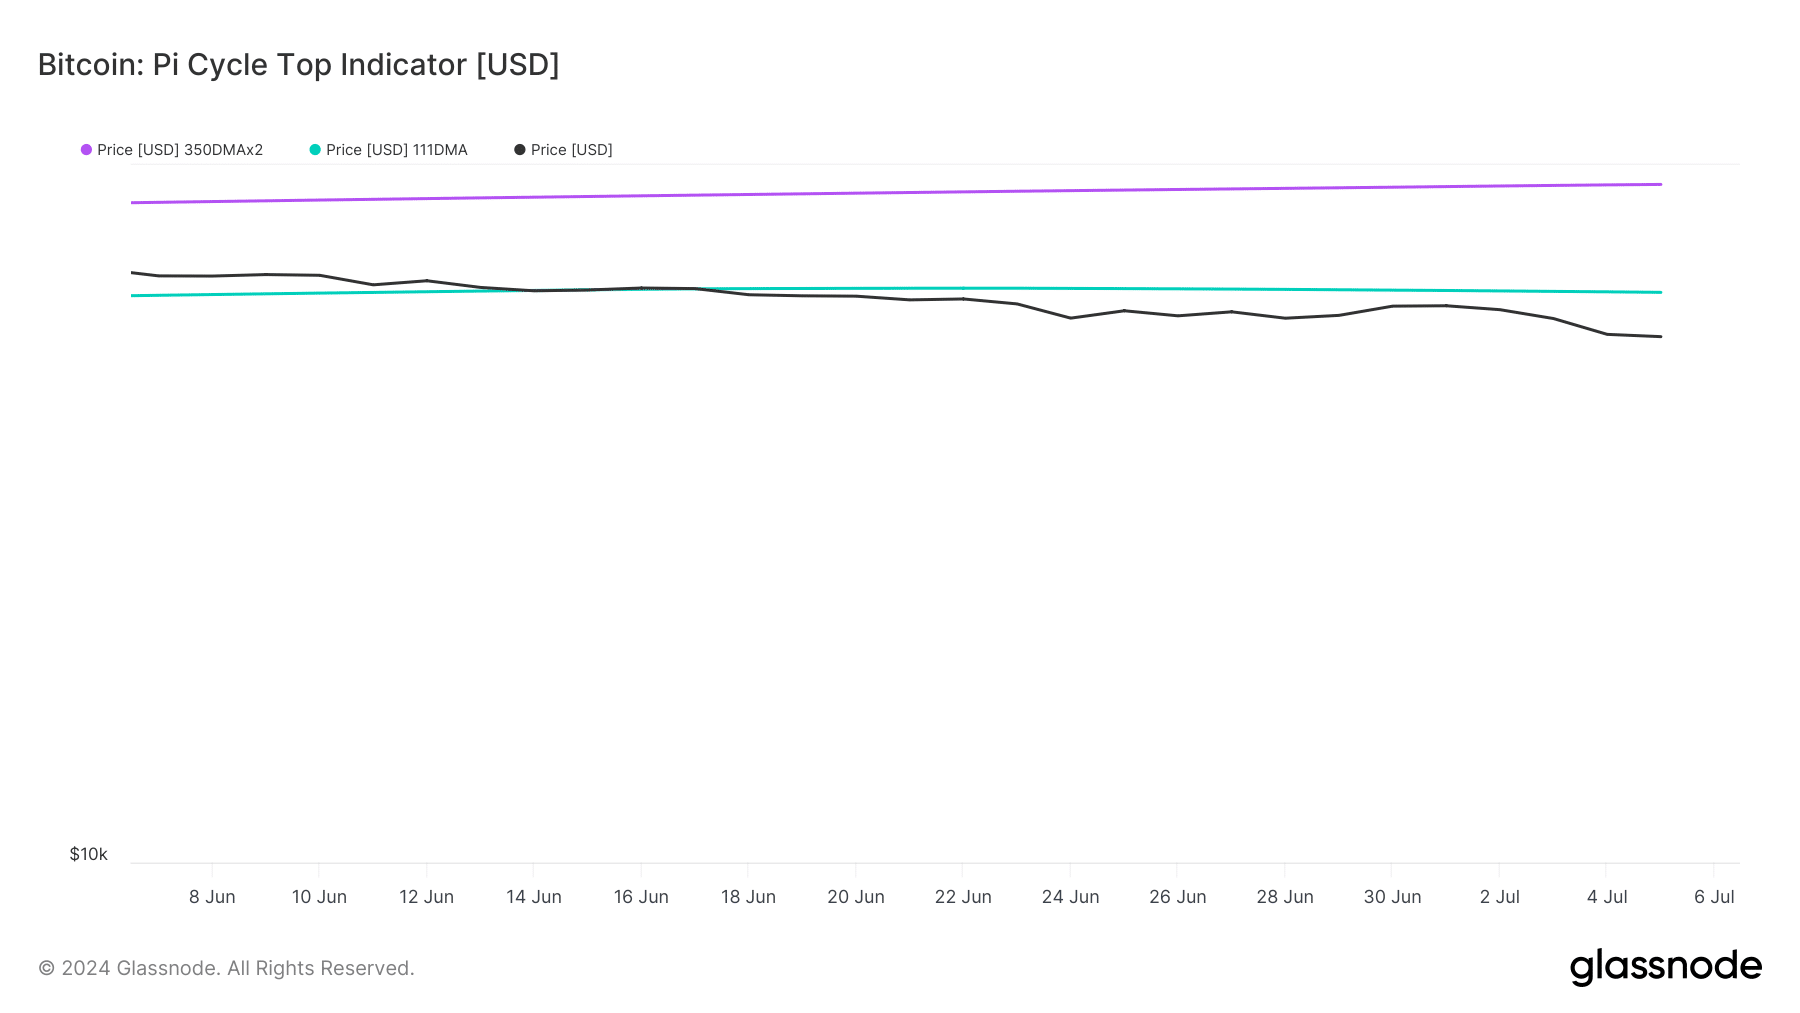
Source: Glassnode
Read Bitcoin’s [BTC] Price Prediction 2024-25
Apart from this, it looked pretty optimistic on the derivatives market front too.
AMBCrypto’s analysis of Coinglass’ data identified that BTC’s long/short ratio increased too. A hike in this metric means that there are more long positions in the market, compared to short positions.
In this case, the long/short ratio suggested that the market sentiment around BTC has been mostly bullish over the last 24 hours.

Source: Coinglass