Bitcoin: Why crossing $71.5K is critical for a fresh rally

- Bitcoin shows signs of continued consolidation, with a potential breakout if it closes above $71,500.
- Historical patterns and strong holder sentiment suggest a bullish future for BTC.
Bitcoin [BTC] has experienced a significant uptrend over the past week, with a price surge of approximately 12.8%.
The rise was spurred by factors such as the anticipation of a spot Ethereum [ETH] ETF and Donald Trump’s recent acceptance of Bitcoin for election donations.
Despite this rise, the cryptocurrency has encountered a slight downturn in the last 24 hours, decreasing by 1.8% from a 24-hour high of $71,422 to its press time price of $69,823.
While the overall trend remains bullish, there are signs of a brief pullback in the market.
Bitcoin: Levels to watch
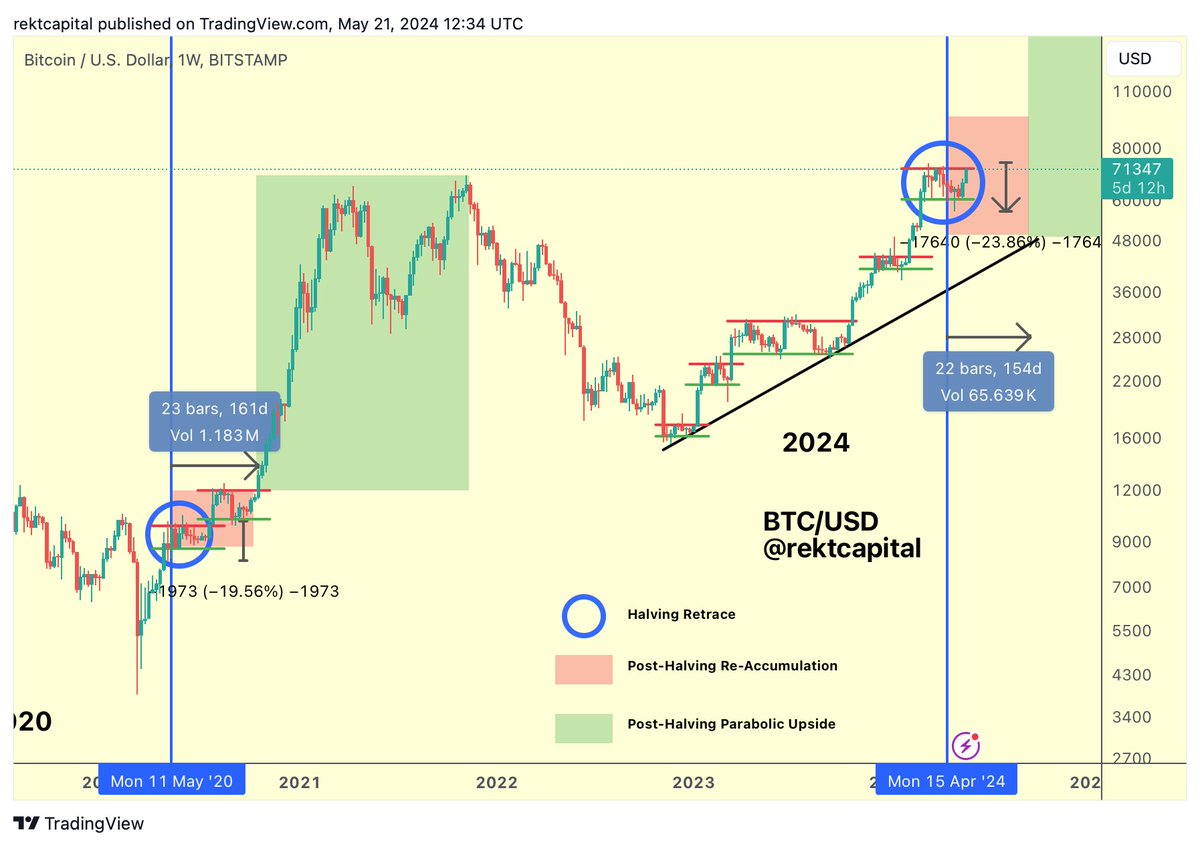
Amid this fluctuating landscape, Crypto analyst Rekt Capital has offered insights into Bitcoin’s market dynamics, presenting a cautious outlook.
He suggests that Bitcoin may continue to consolidate within its current range for several more weeks, according to historical patterns.
A key level to watch is around $71,500; a weekly candle close above this mark could catalyze a breakout from Bitcoin’s Re-Accumulation Range.
Rekt Capital noted that extended consolidation aligned Bitcoin with its historical halving cycles, potentially lengthening the bull run.
The current cycle’s acceleration, around 190 days, marks an improvement from the 260-day acceleration observed in mid-March when Bitcoin hit new all-time highs. The analyst noted,
“History suggests we should see a typically long one but Bitcoin is one Weekly Close above the $71500 Range High from going against the grain of history once again.”
It is worth noting that this scenario could potentially propel Bitcoin to unprecedented heights, achieving a new all-time high (ATH).
Further supporting a bullish outlook, data from CryptoQuant, as highlighted by CEO Ki Young Ju, indicates that Bitcoin holders are reluctant to sell their holdings, even as prices soar to nearly $70,000.
This behavior suggests that Bitcoin is increasingly viewed as a store of value.
According to Ki Young Ju, the Holding Intensity ratio demonstrates that Bitcoin’s holding behavior closely matches scenarios where each coin remains unmoved, reinforcing its status as a long-term investment.
Technical analysis and liquidation trends
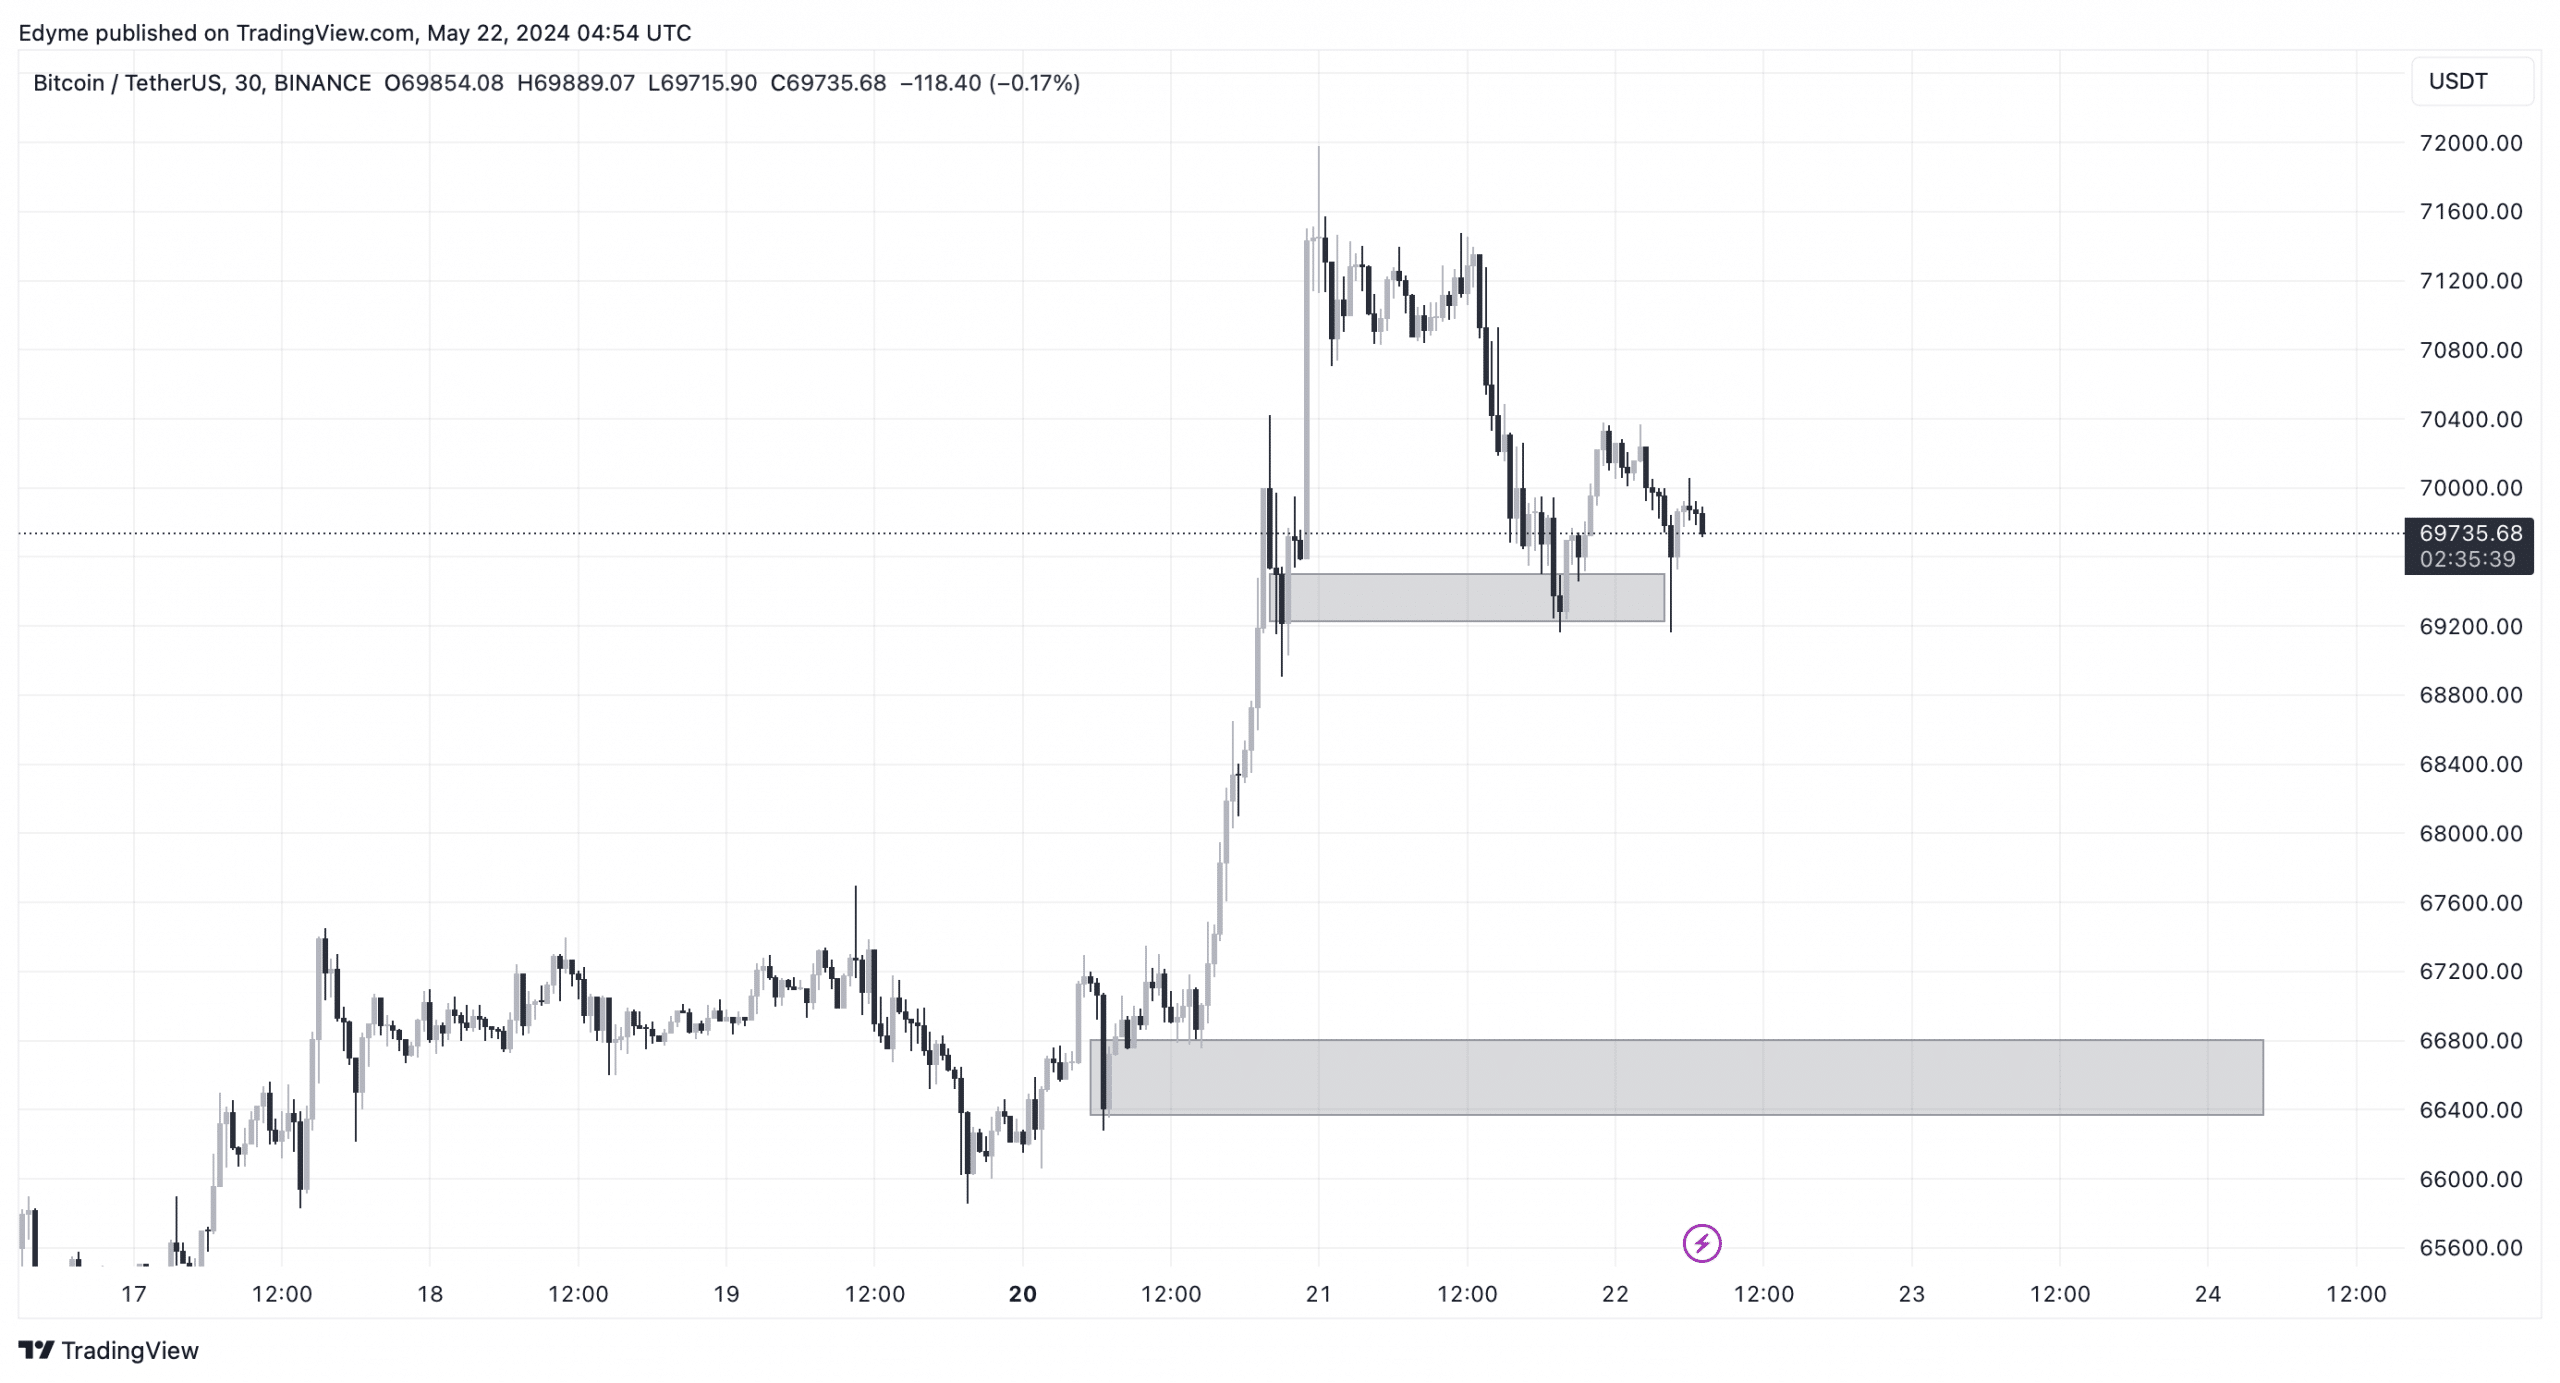
AMBCrypto’s examination of Bitcoin’s 30-minute chart showed that the cryptocurrency recently tested a demand zone without showing signs of upward movement.
Typically, testing a demand zone suggests an impending upward continuation. However, if Bitcoin fails to maintain this zone, we might see a further drop to the $66,000 levels before the uptrend resumes.
Meanwhile, AMBCrypto’s analysis of the liquidation heatmap indicated that significant liquidity existed from $73,300 upwards.
Read Bitcoin’s [BTC] Price Prediction 2024-25
This suggested that Bitcoin could potentially surpass its all-time high, with a target of $76,900 as the next peak.
Liquidation heatmaps are crucial for traders to identify areas of high liquidity, where large liquidations are likely to occur, providing insight into potential price movements.


