- The range formation of April and May gained notability once again.
- The bulls might falter and cede the $60k level to the bears in the coming days.
Bitcoin [BTC] noted losses of 7.84% on the 24th of June, Monday. An earlier AMBCrypto report highlighted that news developments around Mt. Gox repayments could add to the selling pressure on Bitcoin.
The same report also observed that a sudden, sharp price drop could be imminent. A few hours later BTC fell to $58.4k before bouncing slightly to trade at $61.1k at press time.
Will the support zone be defended this time too?
The range formation could be the key
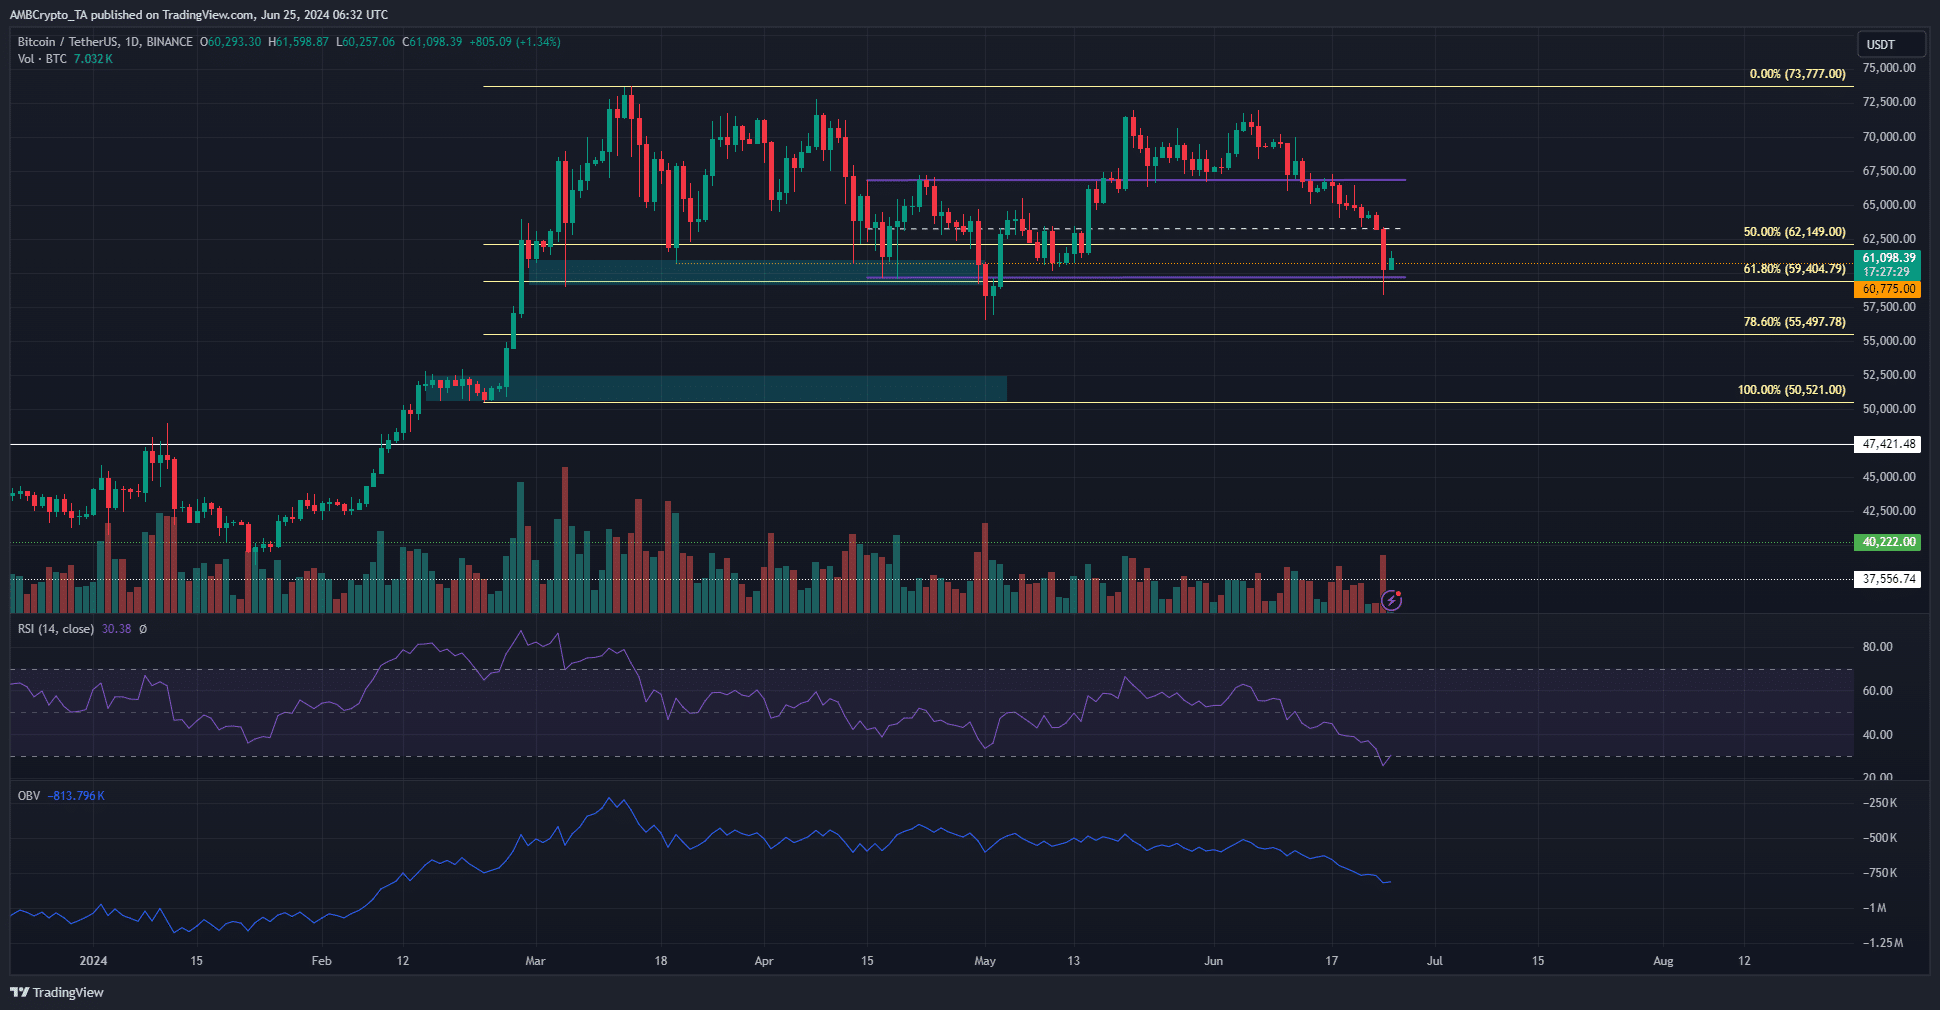
Source: BTC/USDT on TradingView
On Sunday, the 16th of June, Bitcoin bounced from $66k to $66.9k, thus retesting the range highs as resistance. Since then, it has trended downward and was near the lows at $59.7k. It is expected that the $59k-$60k support zone would see BTC recover.
The daily RSI supported this idea. It spiraled down to 25.6 on Monday, but was 30.38 at press time. Therefore, the chances of a recovery are bolstered due to the RSI rallying above 30.
However, the OBV was in a strong downtrend and reflected intense selling pressure over the past two weeks. This trend must be arrested and reversed before bulls regain confidence.
The liquidation heatmap showed traders could experience more pain
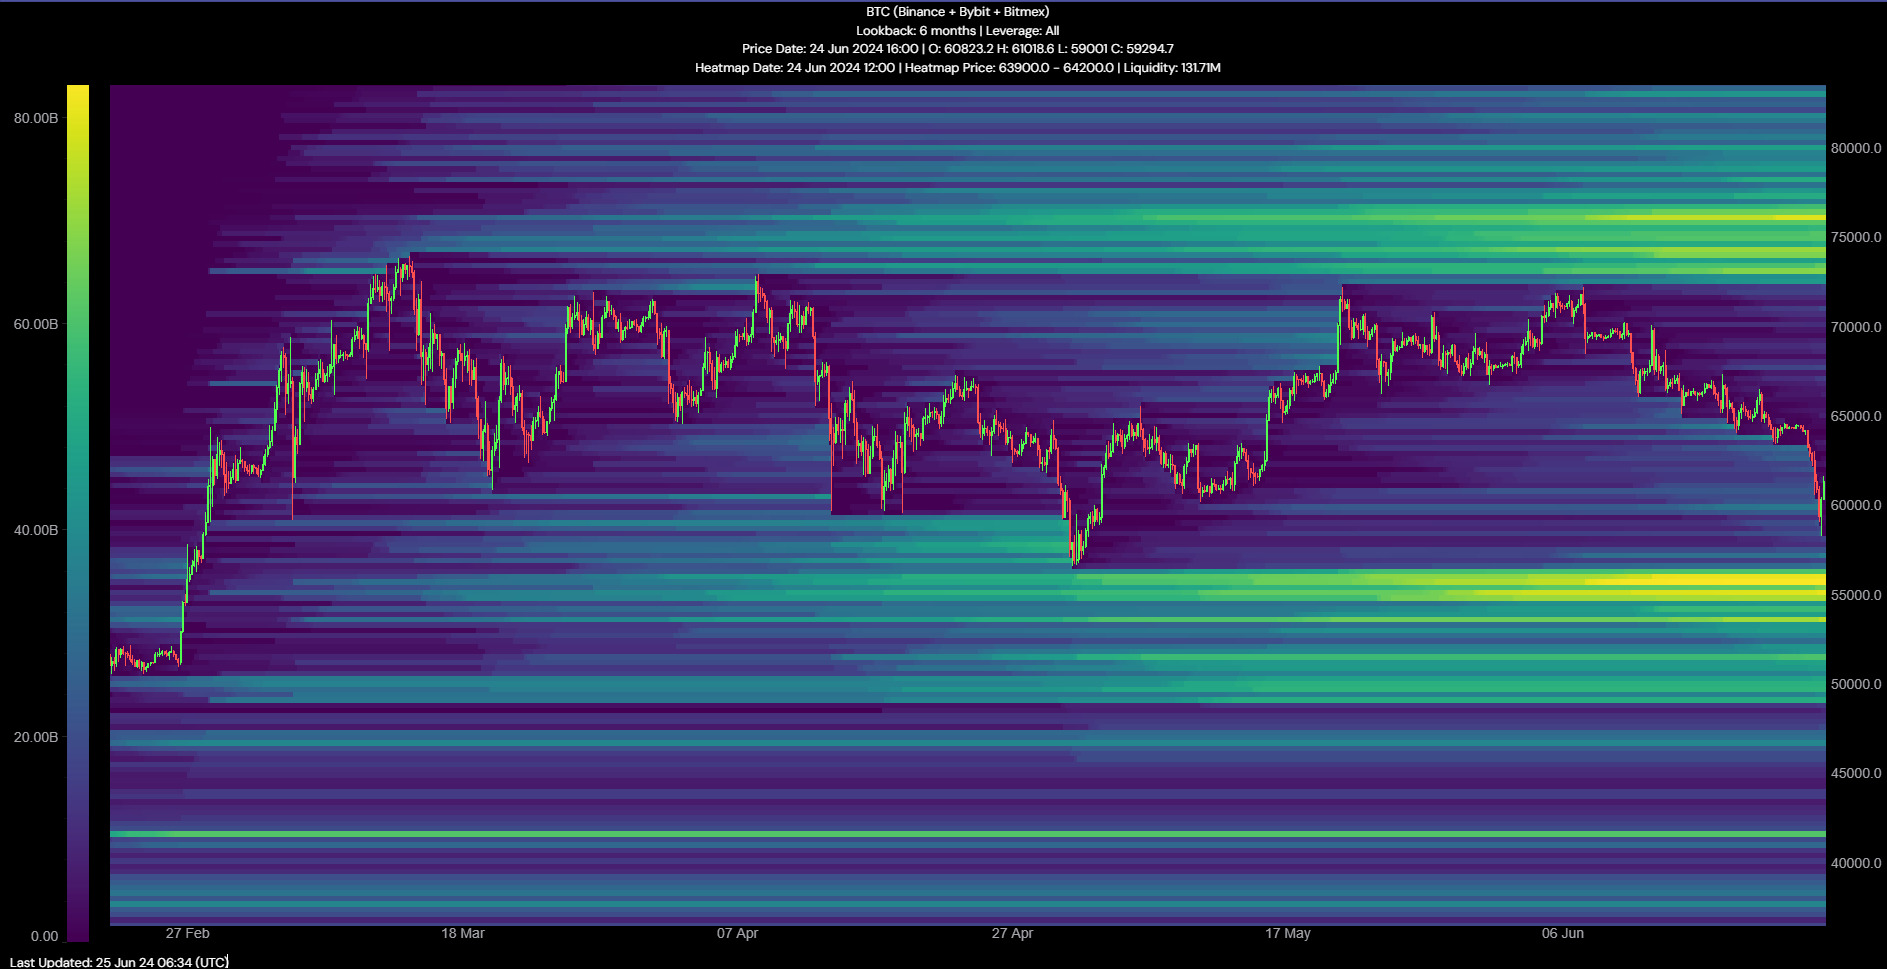
Source: Hyblock
Although the $59k region was a strong demand zone, it might not be enough to stall the bearish pressure. AMBCrypto’s analysis of the liquidation data from Hyblock showed that we are likely to see another 10% BTC price drop soon.
Read Bitcoin’s [BTC] Price Prediction 2024-25
The 6-month lookback period chart showed a high concentration of long liquidations levels around the $55k mark. It is likely to act as a magnetic zone and attract prices to it before the higher timeframe uptrend can resume.
Traders and investors need not sell right away, but a visit to the $55k region could present a buying opportunity instead of inciting panic.
Disclaimer: The information presented does not constitute financial, investment, trading, or other types of advice and is solely the writer’s opinion.