Bitcoin range formation ahead, here’s how you can navigate it

- Bitcoin does not have enough demand in the short term to sustain a rally beyond $60k.
- Traders can prepare for a bearish reversal on Monday but should watch out for volatility.
Bitcoin [BTC] fell by 16.2% between Monday, the 1st of July, and Friday, the 5th of July. After reaching the lowest point at $53.5k, BTC bounced by 9.33% over the next day and a half. The sharp downward price move might see a short-term range formation established.
AMBCrypto analyzed the liquidation charts and the price action to understand where the prices could trend over the next week. Whales were accumulating BTC, but the sentiment was weak, and the coin movement onto exchanges was a concern.
Plotting the Bitcoin price path for the next week
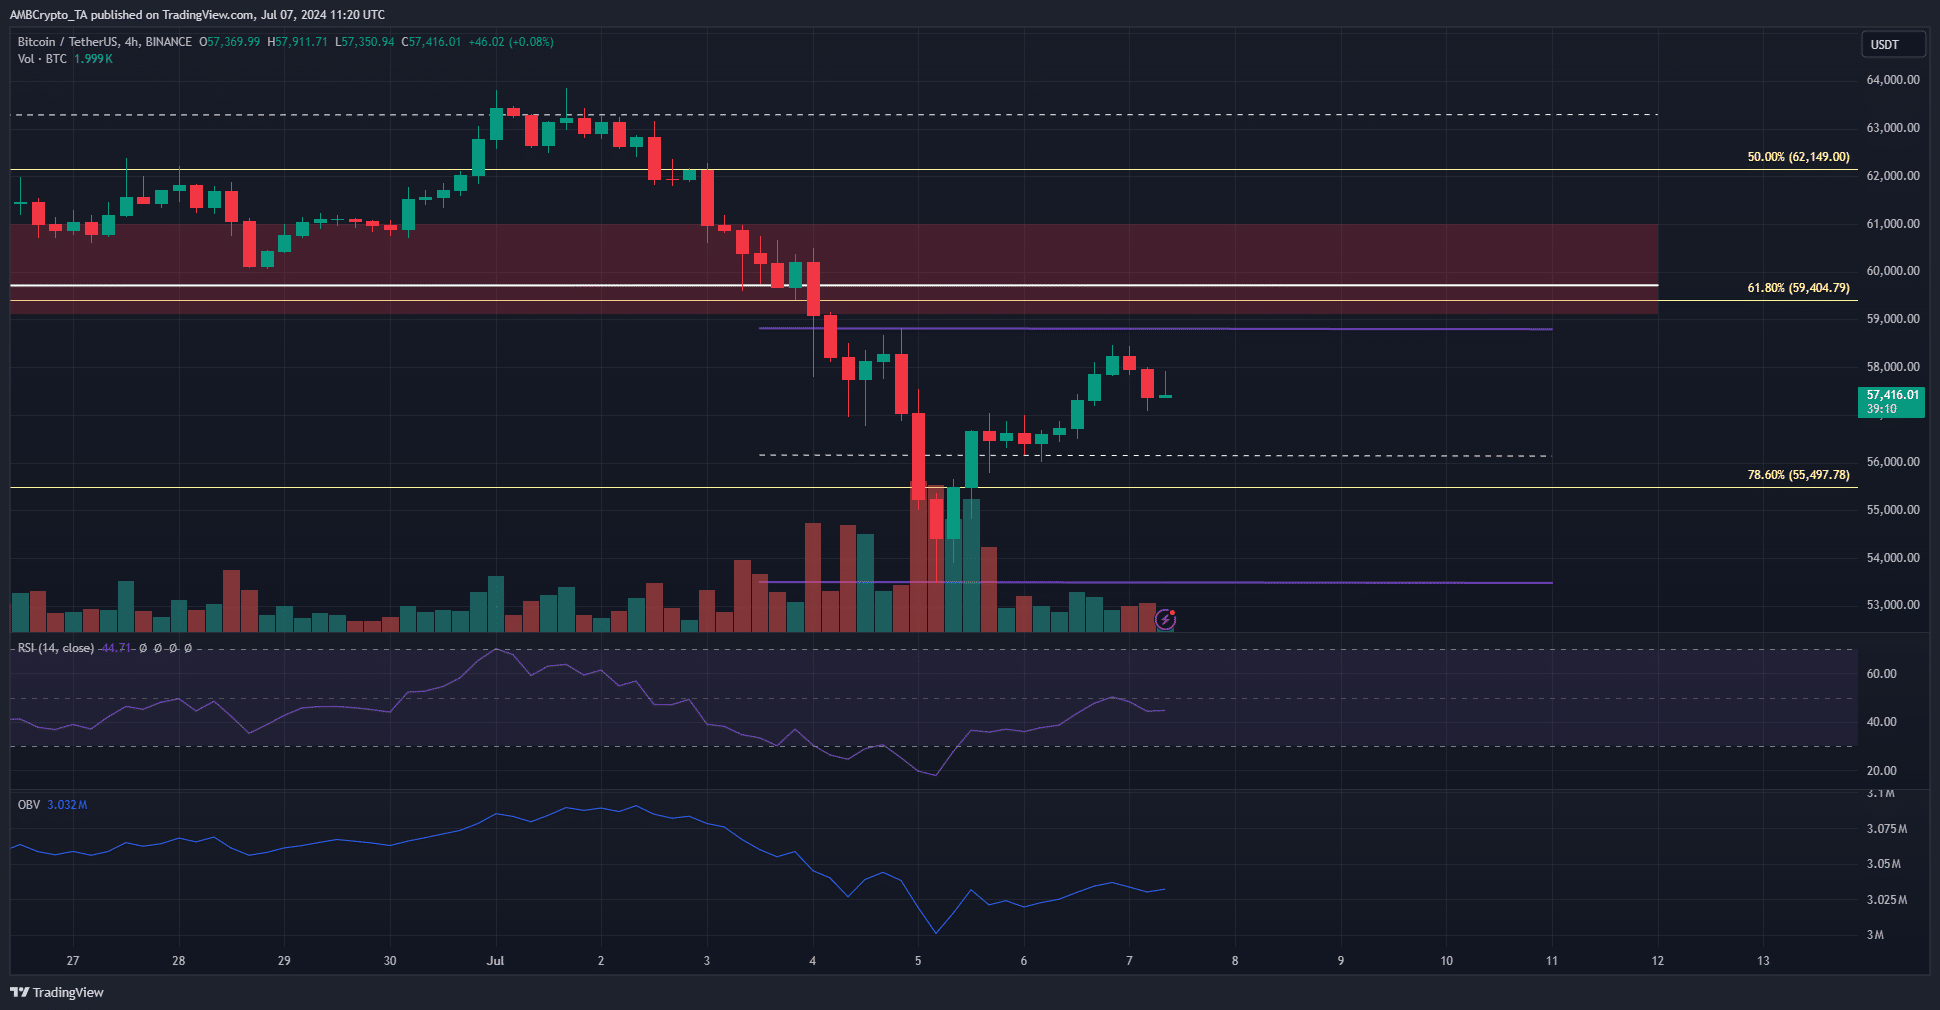
The 4-hour chart showed a potential range formation between $58.8k and $53.5k. The mid-range level at $56.2k had served as support on the 5th of July when prices tried to bounce higher.
The H4 RSI was at 44 and faced rejection at neutral 50. However, the RSI would likely go higher over the next day or two because the range highs beckons BTC prices to it.
The OBV, on the other hand, remained in a downtrend, warning bulls not to take the bait offered.

Source: Hyblock
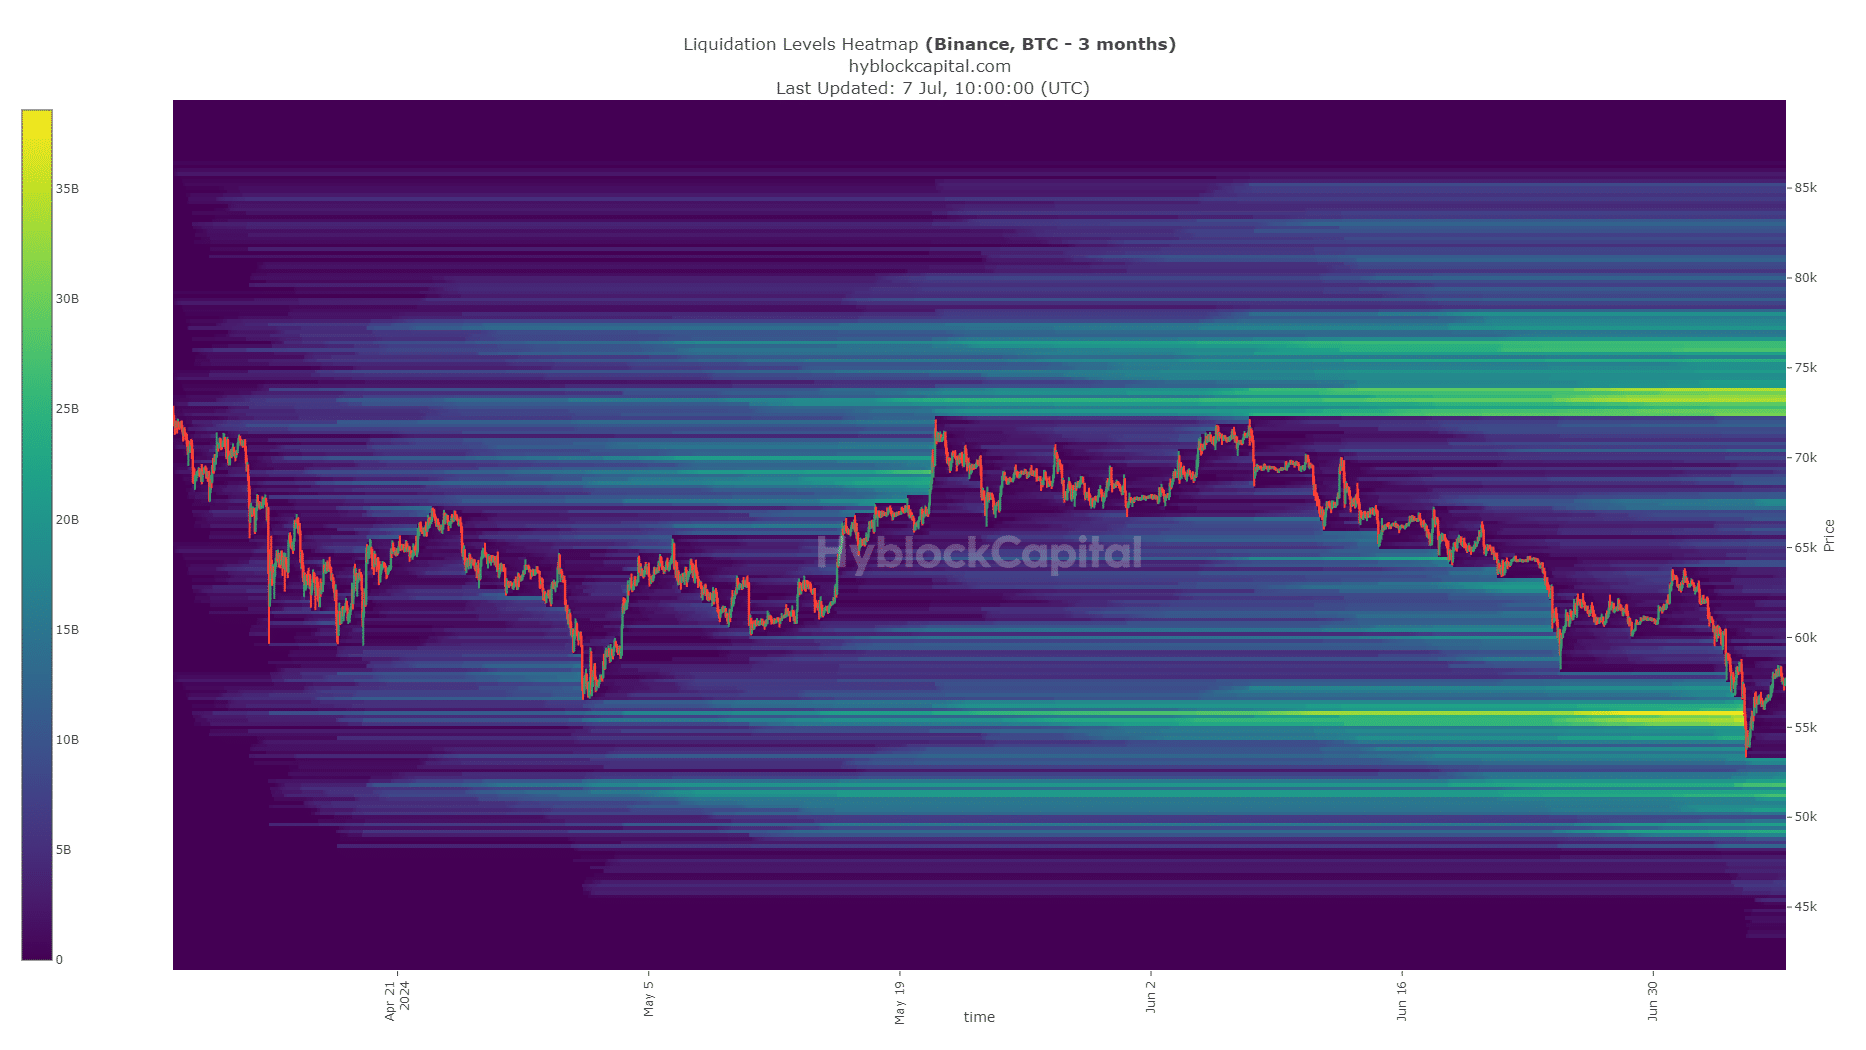
The liquidation heatmap of the past three months showed that the $55.5k region had a high concentration of liquidation levels. This pool of liquidity was swept and in the coming weeks, BTC might seek to run it northward to the $73k liquidity zone.
In the short term, however, an immediate reversal is unlikely. The bulls need time to gather their strength before pushing higher. The range formation outlined earlier is expected to last over the coming week.
Outlining the key Bitcoin price levels

Source: Hyblock
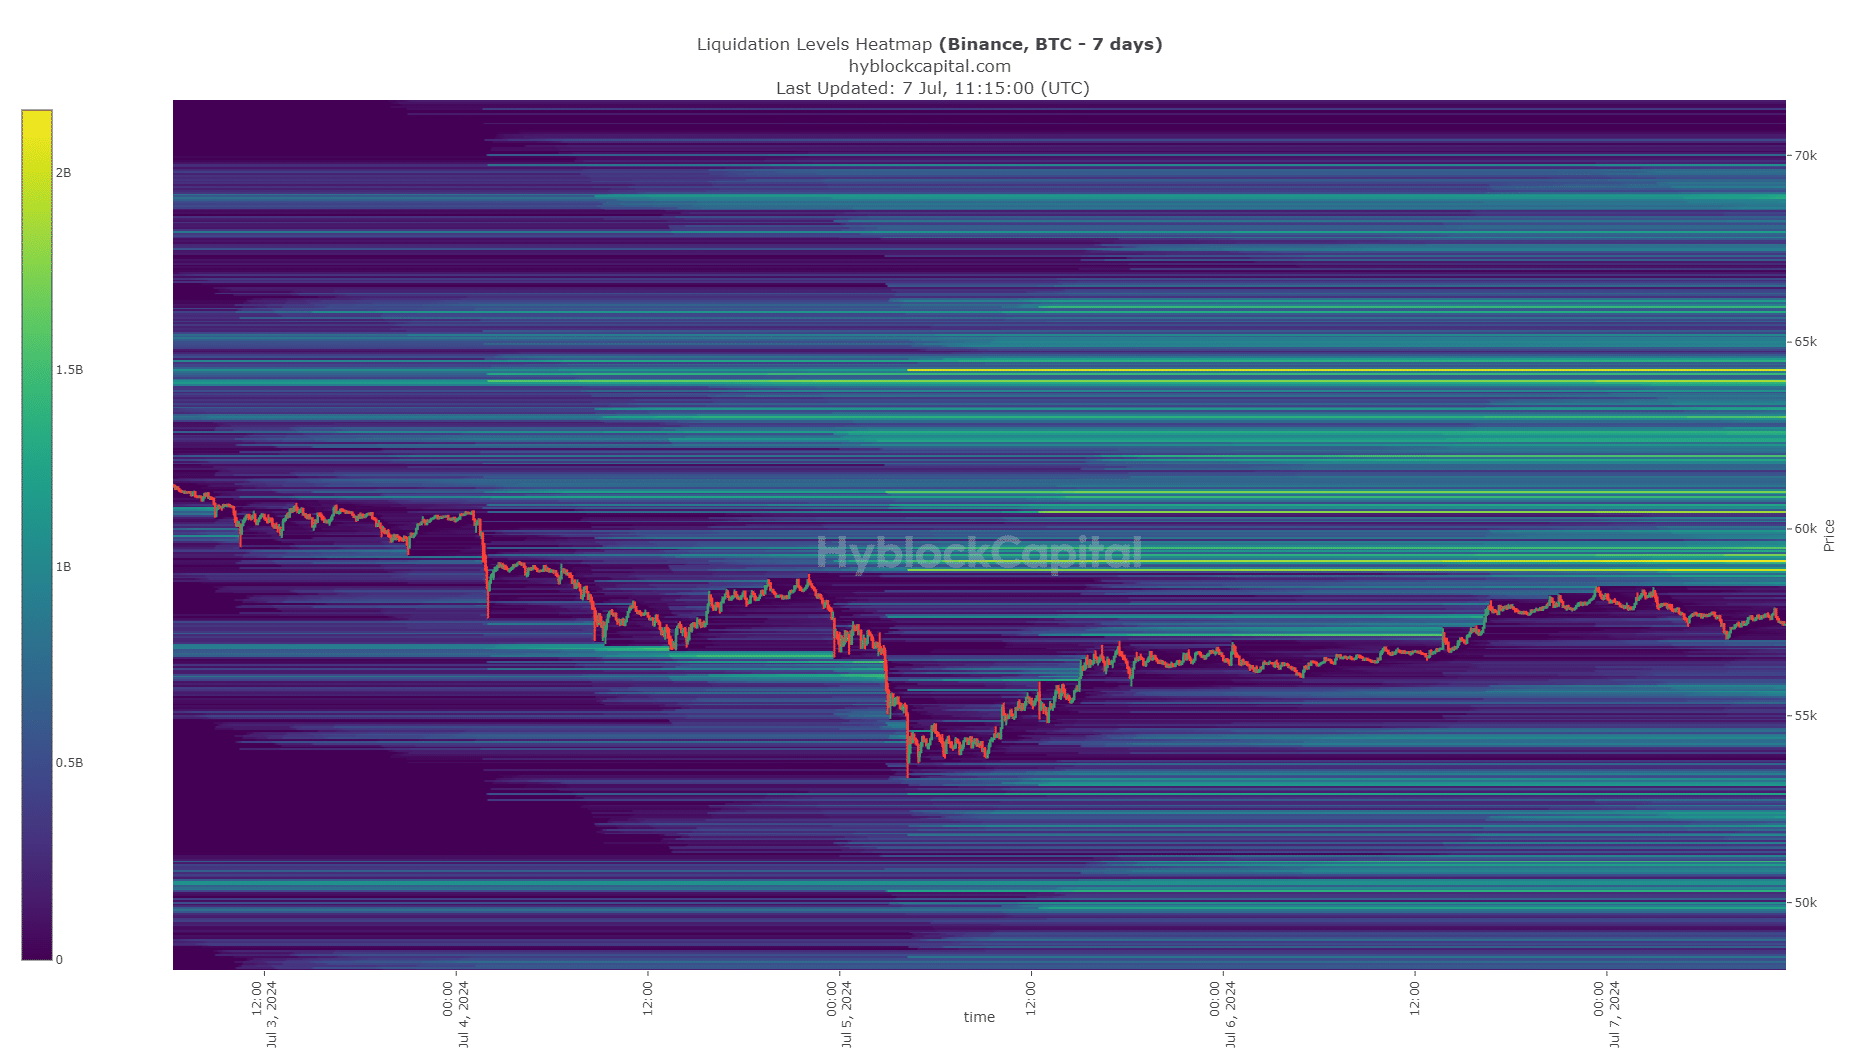
The 7-day liquidation heatmap showed that the $59k-$59.3k zone has bunched up liquidation levels. This lined up well with the $58.8k range highs.
The magnetic zone below $60k is likely to draw Bitcoin prices to it.

Source: Hyblock
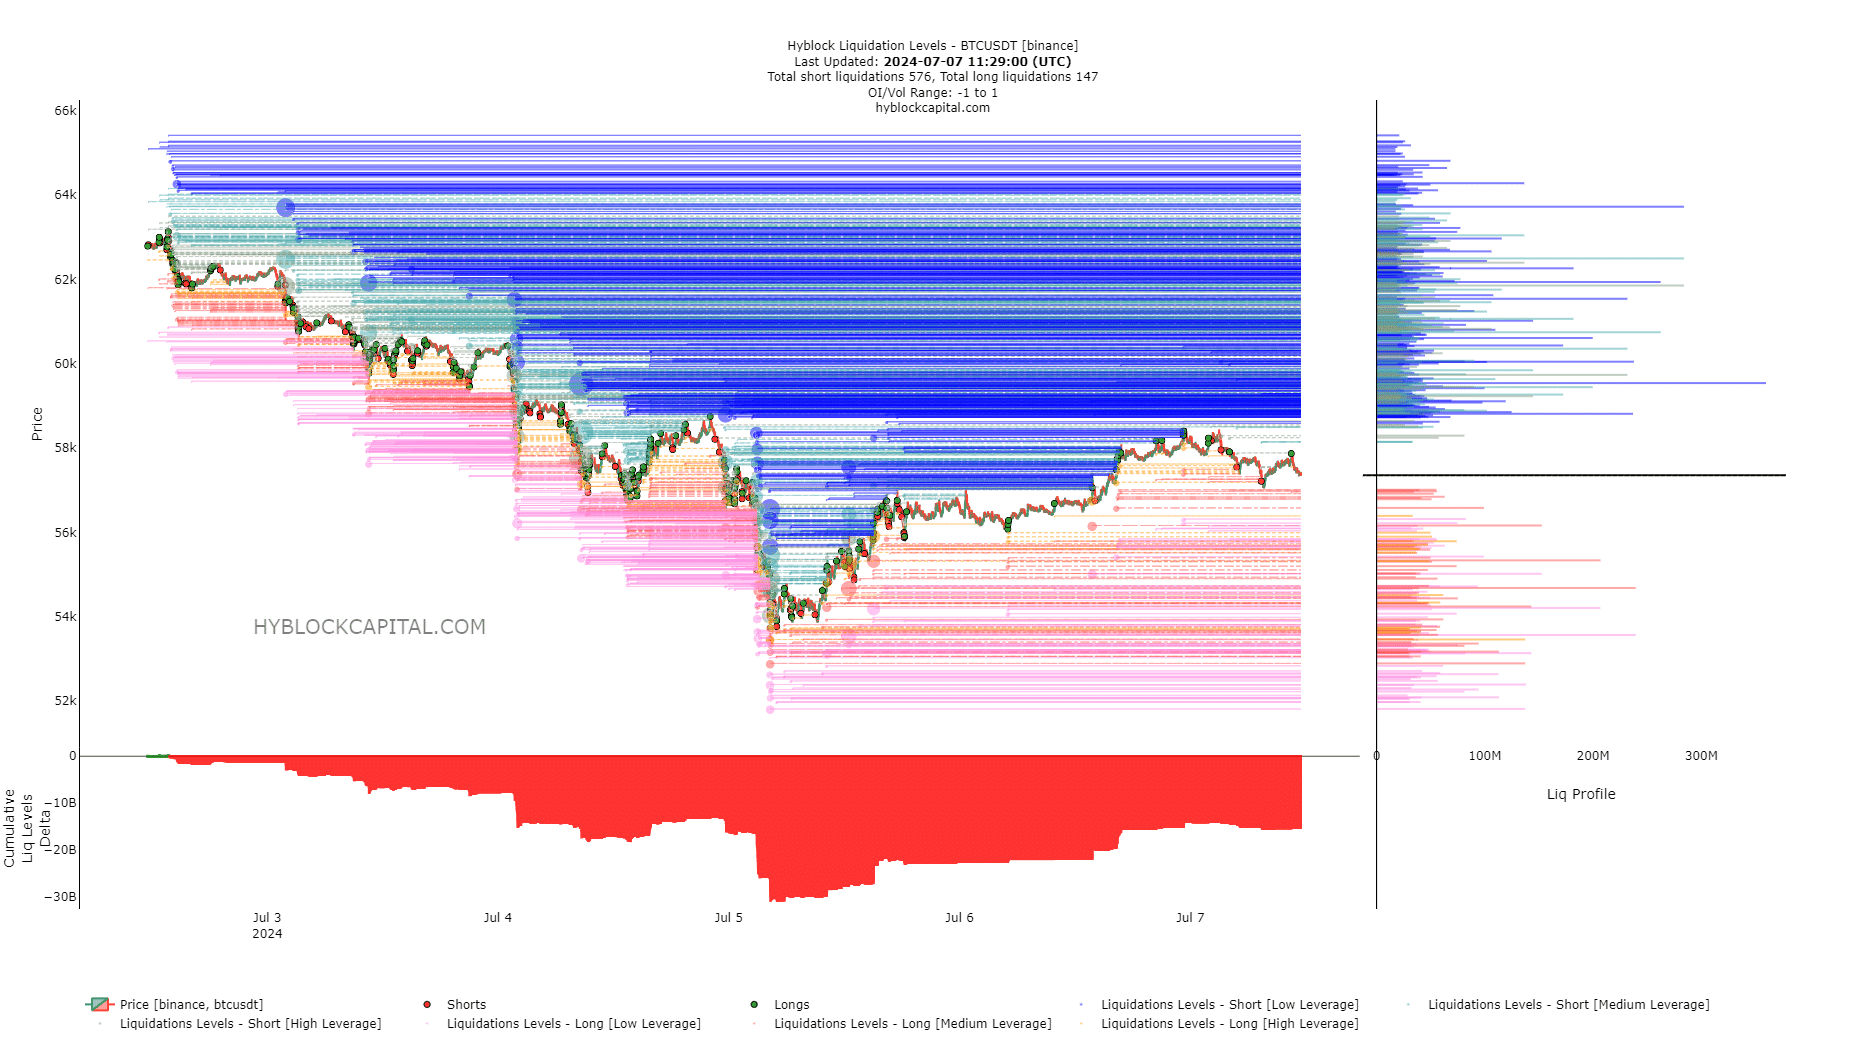
AMBCrypto also analyzed the liquidation levels. They revealed that the cumulative liq levels delta was still largely negative but has withdrawn slightly since its maximum on the 5th of July.
Therefore, a move upward to hunt the overleveraged short sellers might commence on Monday, the 8th of July.
Read Bitcoin’s [BTC] Price Prediction 2024-25
While the king of crypto does not have enough bullish sentiment or demand to fuel a quick rally, traders should not ignore the potential of a breakout past $60k.
As things stand, a bearish reversal from the $59.2k area is anticipated, with volatility around the New York Open at 1 PM UTC on Monday something to beware of.


