Bitcoin Price analysis: Market has very less volatility, but bearish sentiment is more prominent

Bitcoin was trading at $10,043 at press time with a minimal gain of 0.43% on the 24-hr price chart. The total market cap of the coin stood at $180 billion.
1-Hour Price Chart
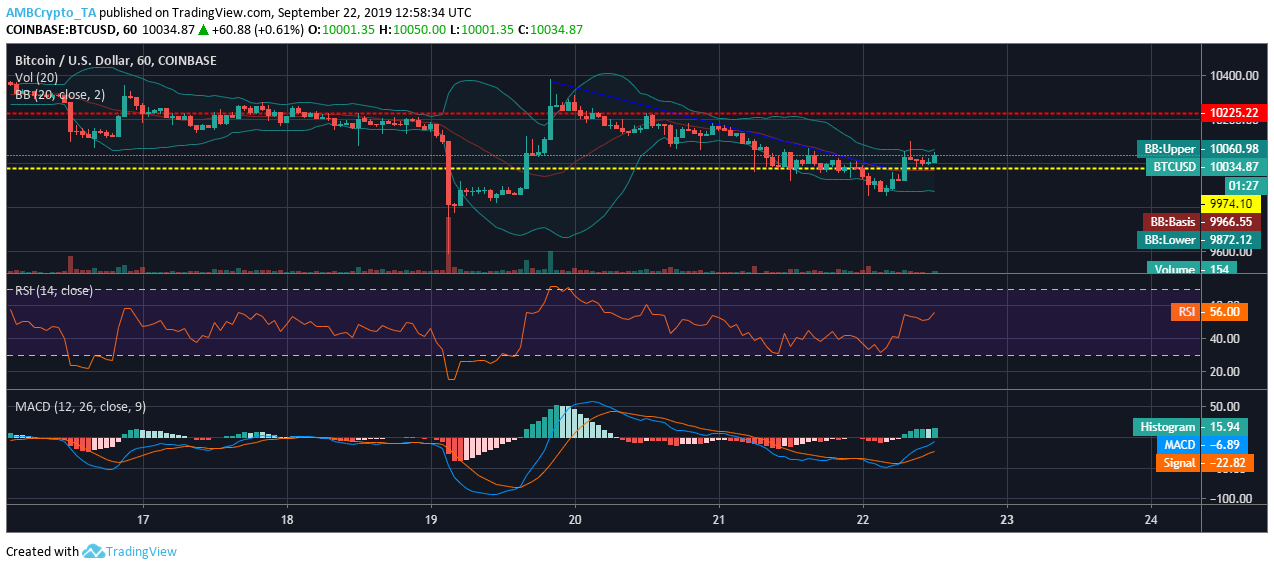
In the 1-hour price chart, Bitcoin is exhibiting very less volatility with the immediate support forming at $9974.84. Bitcoin needs to break through the resistance point of $10,225. 70 to show bullish momentum. Bitcoin is showing a downtrend starting from $10,367 to $9975.
The Bollinger Band indicator showed the price volatility was quite high on 20th September, however, the volatility fluctuation in prices decreased drastically on since later half of 21st September.
The RSI indicator suggested that Bitcoin was oversold on 19th September while people overbought Bitcoin towards the end of 19th Septemeber. The market stabilized in the following days, however, the sentiment was more bearish.
The MACD indicator showed bearish sentiment starting on 19th September, and however, on 20th Septemeber the sentiment was more bullish and then again laned towards the bearish side.
1-Day Price Chart
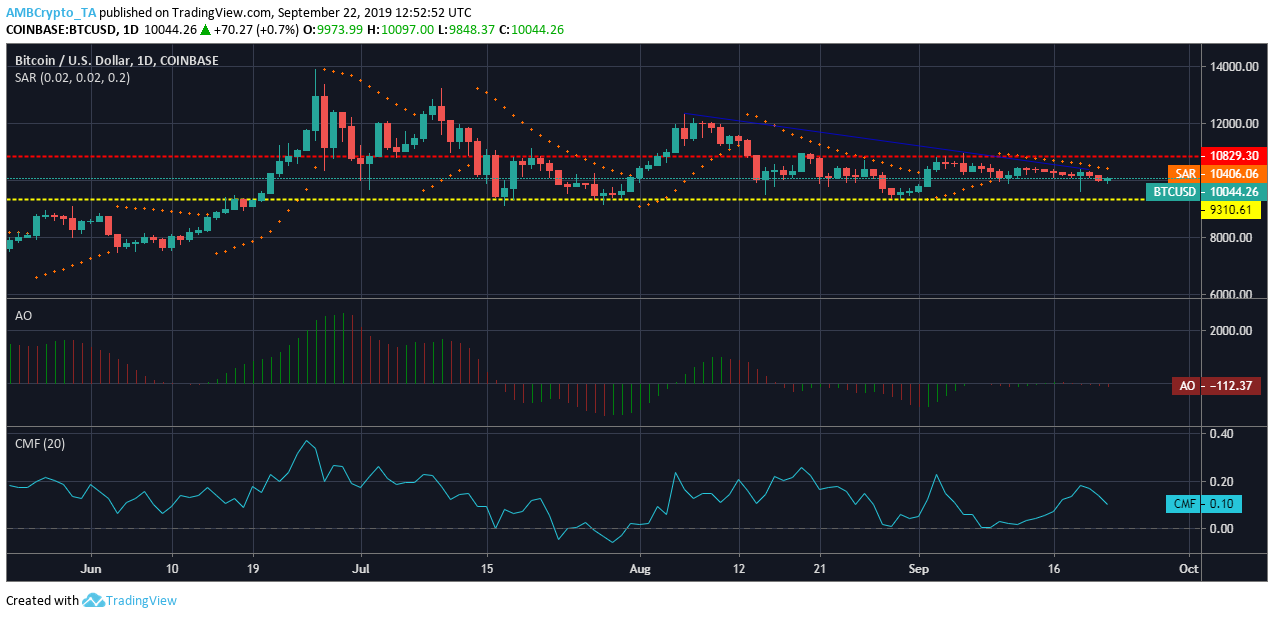
Looking at the one-day price chart, Bitcoin is forming immediate support at $9310.61. The resistance that Bitcoin needs to break through stands at $10,829.30. On the one-day price-chart Bitcoin is showing a downward trend from $12,269 to $10,478.
The Parabolic SAR Indicator showed that the markers are above the candle from 10th September indicating bullish sentiments are high.
The Awesome Oscillator indicated that the market is fluctuating in the long term with minimal momentum, however, in the short term it’s more on the bearish side.
The Chaikin Money Flow or CMF showed that the amount of capital coming into the market is high since 1st august
Conclusion
Bitcoin is looking stable at the moment with its prices hovering below the $10,100 mark and people are buying it more than selling it.


