Bitcoin inches toward $69K: Is BTC poised for a new peak?

- Bitcoin’s price increased by over 3% in the last seven days.
- Most market indicators and metrics looked bullish on BTC.
Investors have become skeptical of Bitcoin [BTC] as it is failing to hold its price above $70k. However, there was more to the story, as BTC has the potential to reach new highs soon, but only if history repeats itself.
Bitcoin has a plan
CoinMarketCap’s data revealed that after dropping from $70k and reaching $68k, the king of cryptos was once again inching towards $69k. The coin’s price had increased by over 3% in the last seven days.
At the time of writing, BTC was trading at $68,953.86 with a market capitalization of over $1.35 trillion.
Mags, a popular crypto analyst, recently posted a tweet that gave hope for a massive price surge. As per the tweet, there were many similarities between BTC’s 2016 cycle and the current 2024 cycle.
The RSI just returned from the overbought zone while the price moved sideways, which looked similar to that of 2016.
To be precise, in 2016, the RSI surged from 60 to 90 three times before the price eventually peaked. As of now, the metric has spiked only once, suggesting that BTC’s bull rally is far from ending anytime soon.
Therefore, if history repeats itself and BTC follows the same trend, investors might see BTC reach an all-time high.
Do metrics support a rally?
AMBCrypto then analyzed CryptoQuant’s data to see whether metrics were bullish on the king of cryptos. We found that BTC’s net deposit on exchanges was low compared to the last seven-day average, hinting at lower selling pressure.
Miners were also selling at a moderate rate, which was evident from its low MPI.
Additionally, its funding rate was also green. This meant that derivatives investors were actively buying BTC. However, market sentiment around the king of cryptos looked pretty bearish.
As per our analysis, both Coinbase Premium and Korea Premium were red, indicating selling sentiment was dominant among US and Korean investors.
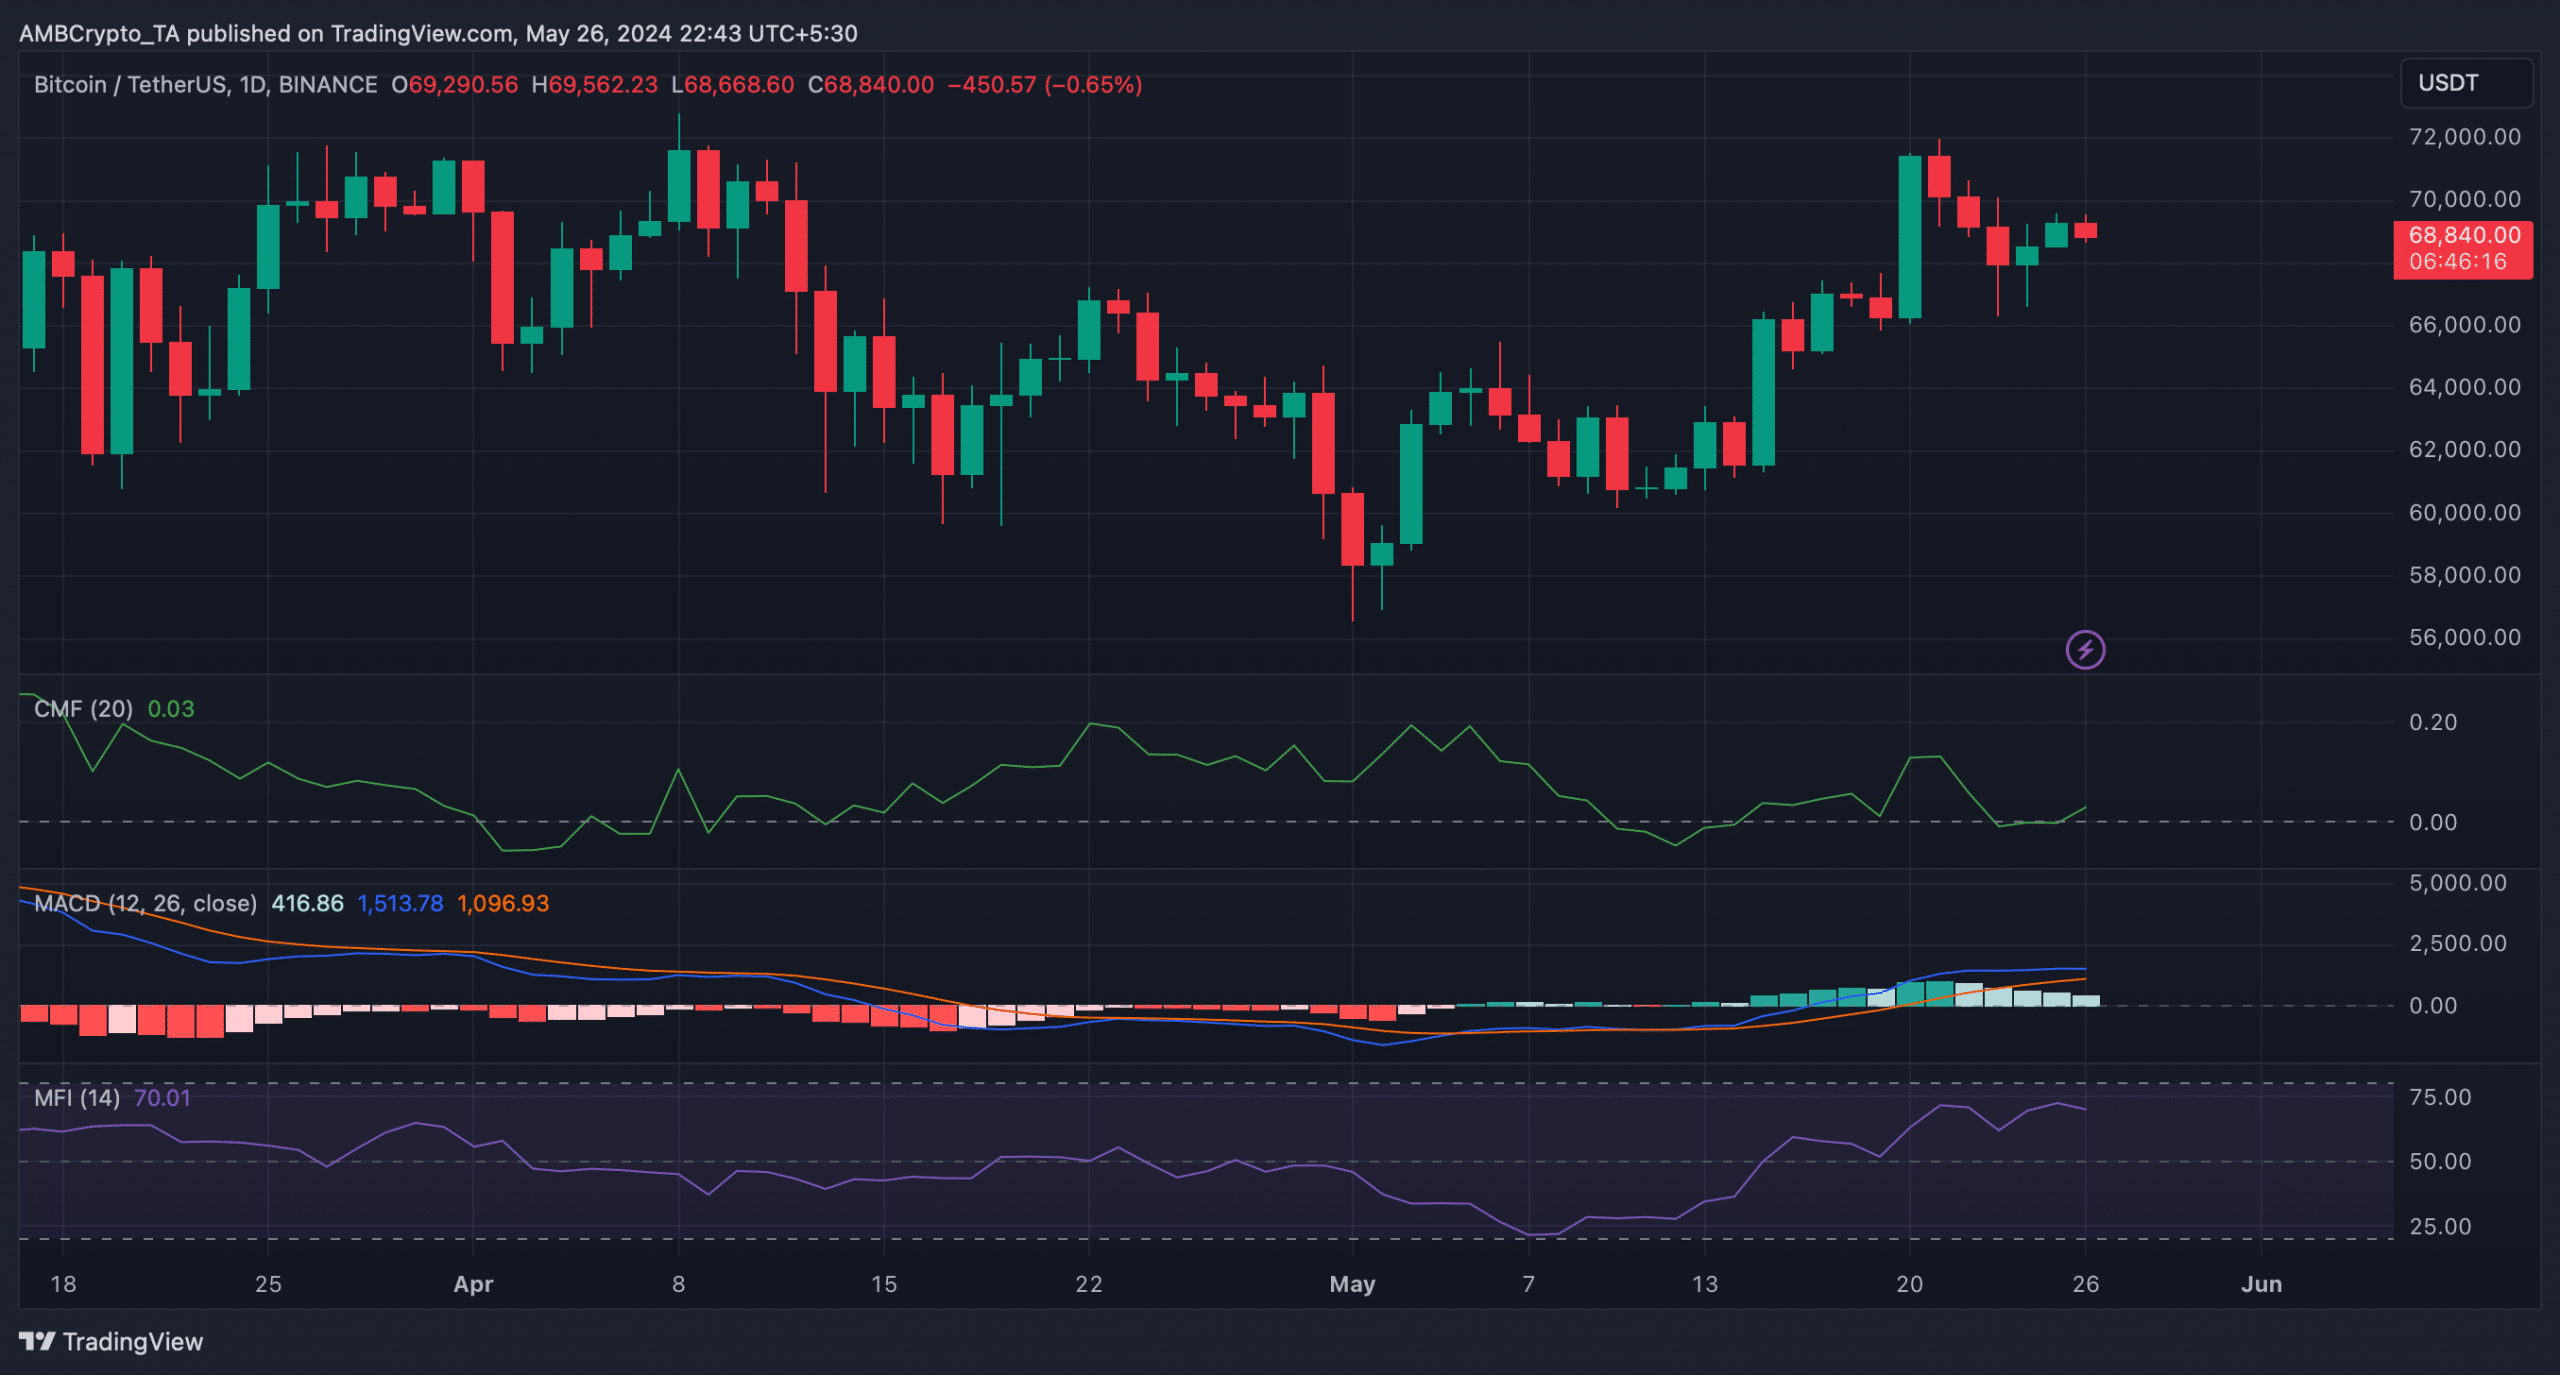
We then analyzed BTC’s daily chart to better understand which way it was headed. We found that the MACD displayed a bullish advantage in the market.
Is your portfolio green? Check the Bitcoin Profit Calculator
The Chaikin Money Flow (CMF) also registered a sharp uptick. These indicators suggested that the chances of BTC turning bullish were high.
However, not every indicator supports the bulls. For example, after a sharp increase, the Money Flow Index (MFI) started to decline, which indicated a price correction in the coming days.


