Bitcoin
Bitcoin: Analyst predicts a drop to $54k – Time to cash out?
A key indicator suggested that Bitcoin might drop to $54k, but a few metrics hinted at a price hike.
- BTC’s price declined by nearly 4% in the last 24 hours.
- Metrics suggested that selling pressure was weak on BTC.
After touching $68k on the 13th of June, Bitcoin’s [BTC] price turned bearish as the coin’s weekly and daily charts remained red.
Meanwhile, a key indicator revealed that its price had touched and dropped from a critical level, which could trigger a further price correction in the coming days.
Bitcoin’s dark future
CoinMarketCap’s data revealed that Bitcoin’s price dropped by nearly 4% in the last seven days. At the time of writing, BTC was trading at $65,243.97 with a market capitalization of over $1.28 trillion.
It was interesting to note that despite the recent price drop, the majority of BTC’s supply was in profit. To be precise, AMBCrypto reported earlier that 87% of BTC’s total supply was in profit.
In the meantime, Ali, a popular crypto analyst, posted a tweet highlighting a possible price correction. As per the tweet, BTC’s price dropped below the +0.5σ MVRV pricing band.
This suggests that it may trigger a correction toward the mean pricing band of $54,930. Therefore, AMBCrypto planned to have a closer look at BTC’s current state to see how likely it is for BTC to drop to $54k.
Is a price correction inevitable?
AMBCrypto’s look at CryptoQuant’s data revealed that BTC’s exchange reserve was dropping. This meant that selling pressure on the coin was relatively weak.
As per the Miners’ Position Index, miners were selling fewer holdings compared to its one-year average, suggesting that miners were willing to hold BTC as they expected the coin’s price to rise.
Things in the derivatives market also looked pretty optimistic. For instance, its taker buy/sell ratio was green, meaning that buying sentiment was dominant in the derivatives market.
Additionally, BTC’s funding rate was also rising, meaning that long-position traders are dominant and are willing to pay short-position traders.
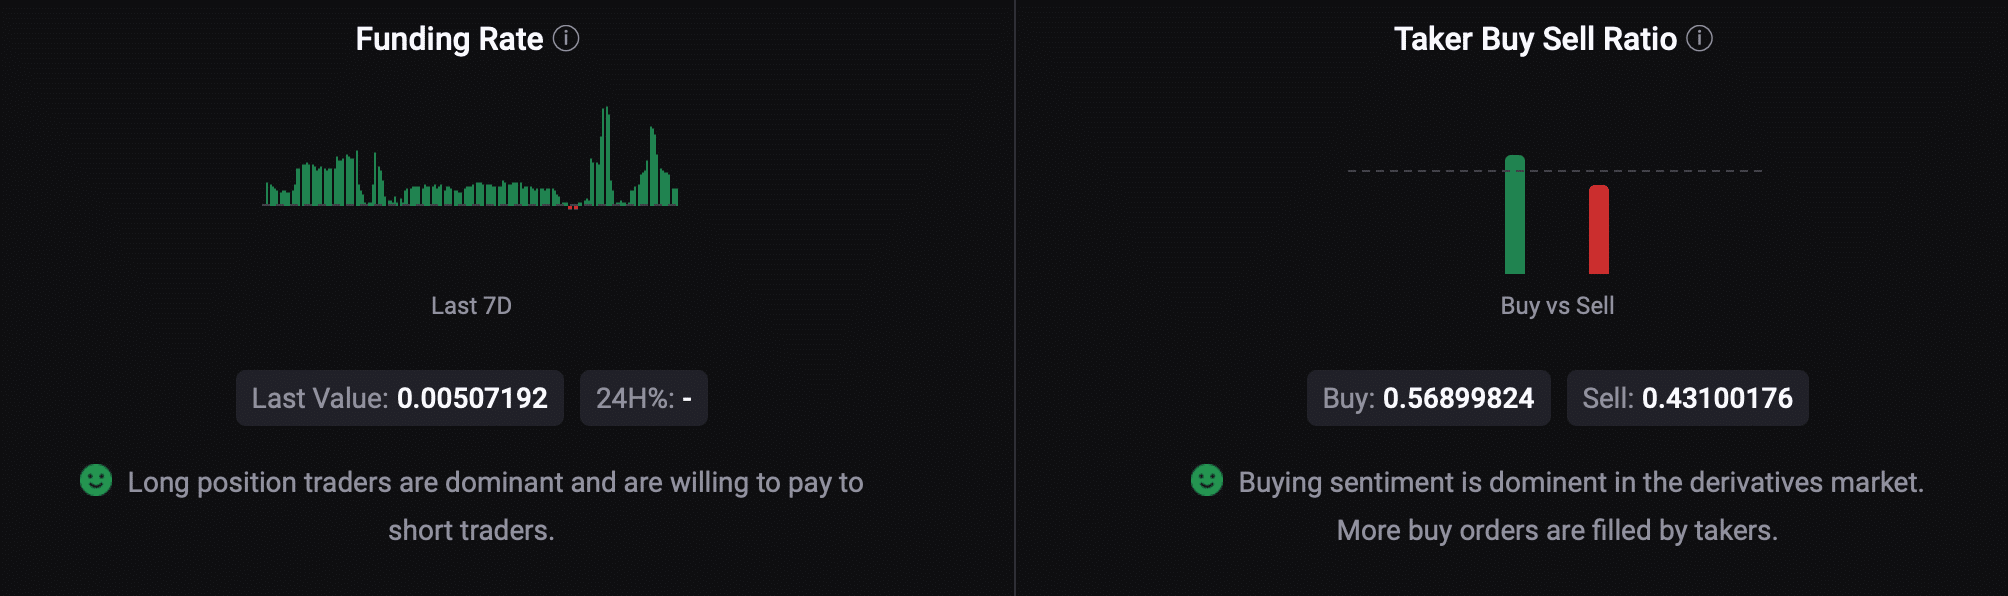
Source: CryptoQuant
We then checked the king of cryptos’ daily chart to better understand what to expect from it in the near term.
As per our analysis of BTC’s daily chart, its Relative Strength Index (RSI) showed bullish momentum as it went up. A similar increasing trend was also noted on the coin’s Chaikin Money Flow (CMF) chart.
Read Bitcoin’s [BTC] Price Prediction 2024-25
These indicators suggested that investors might soon witness a price increase.
However, the Money Flow Index (MFI) looked bearish as it dropped. The indicator hinted at a continued price decline, which might result in BTC dropping to $54k.
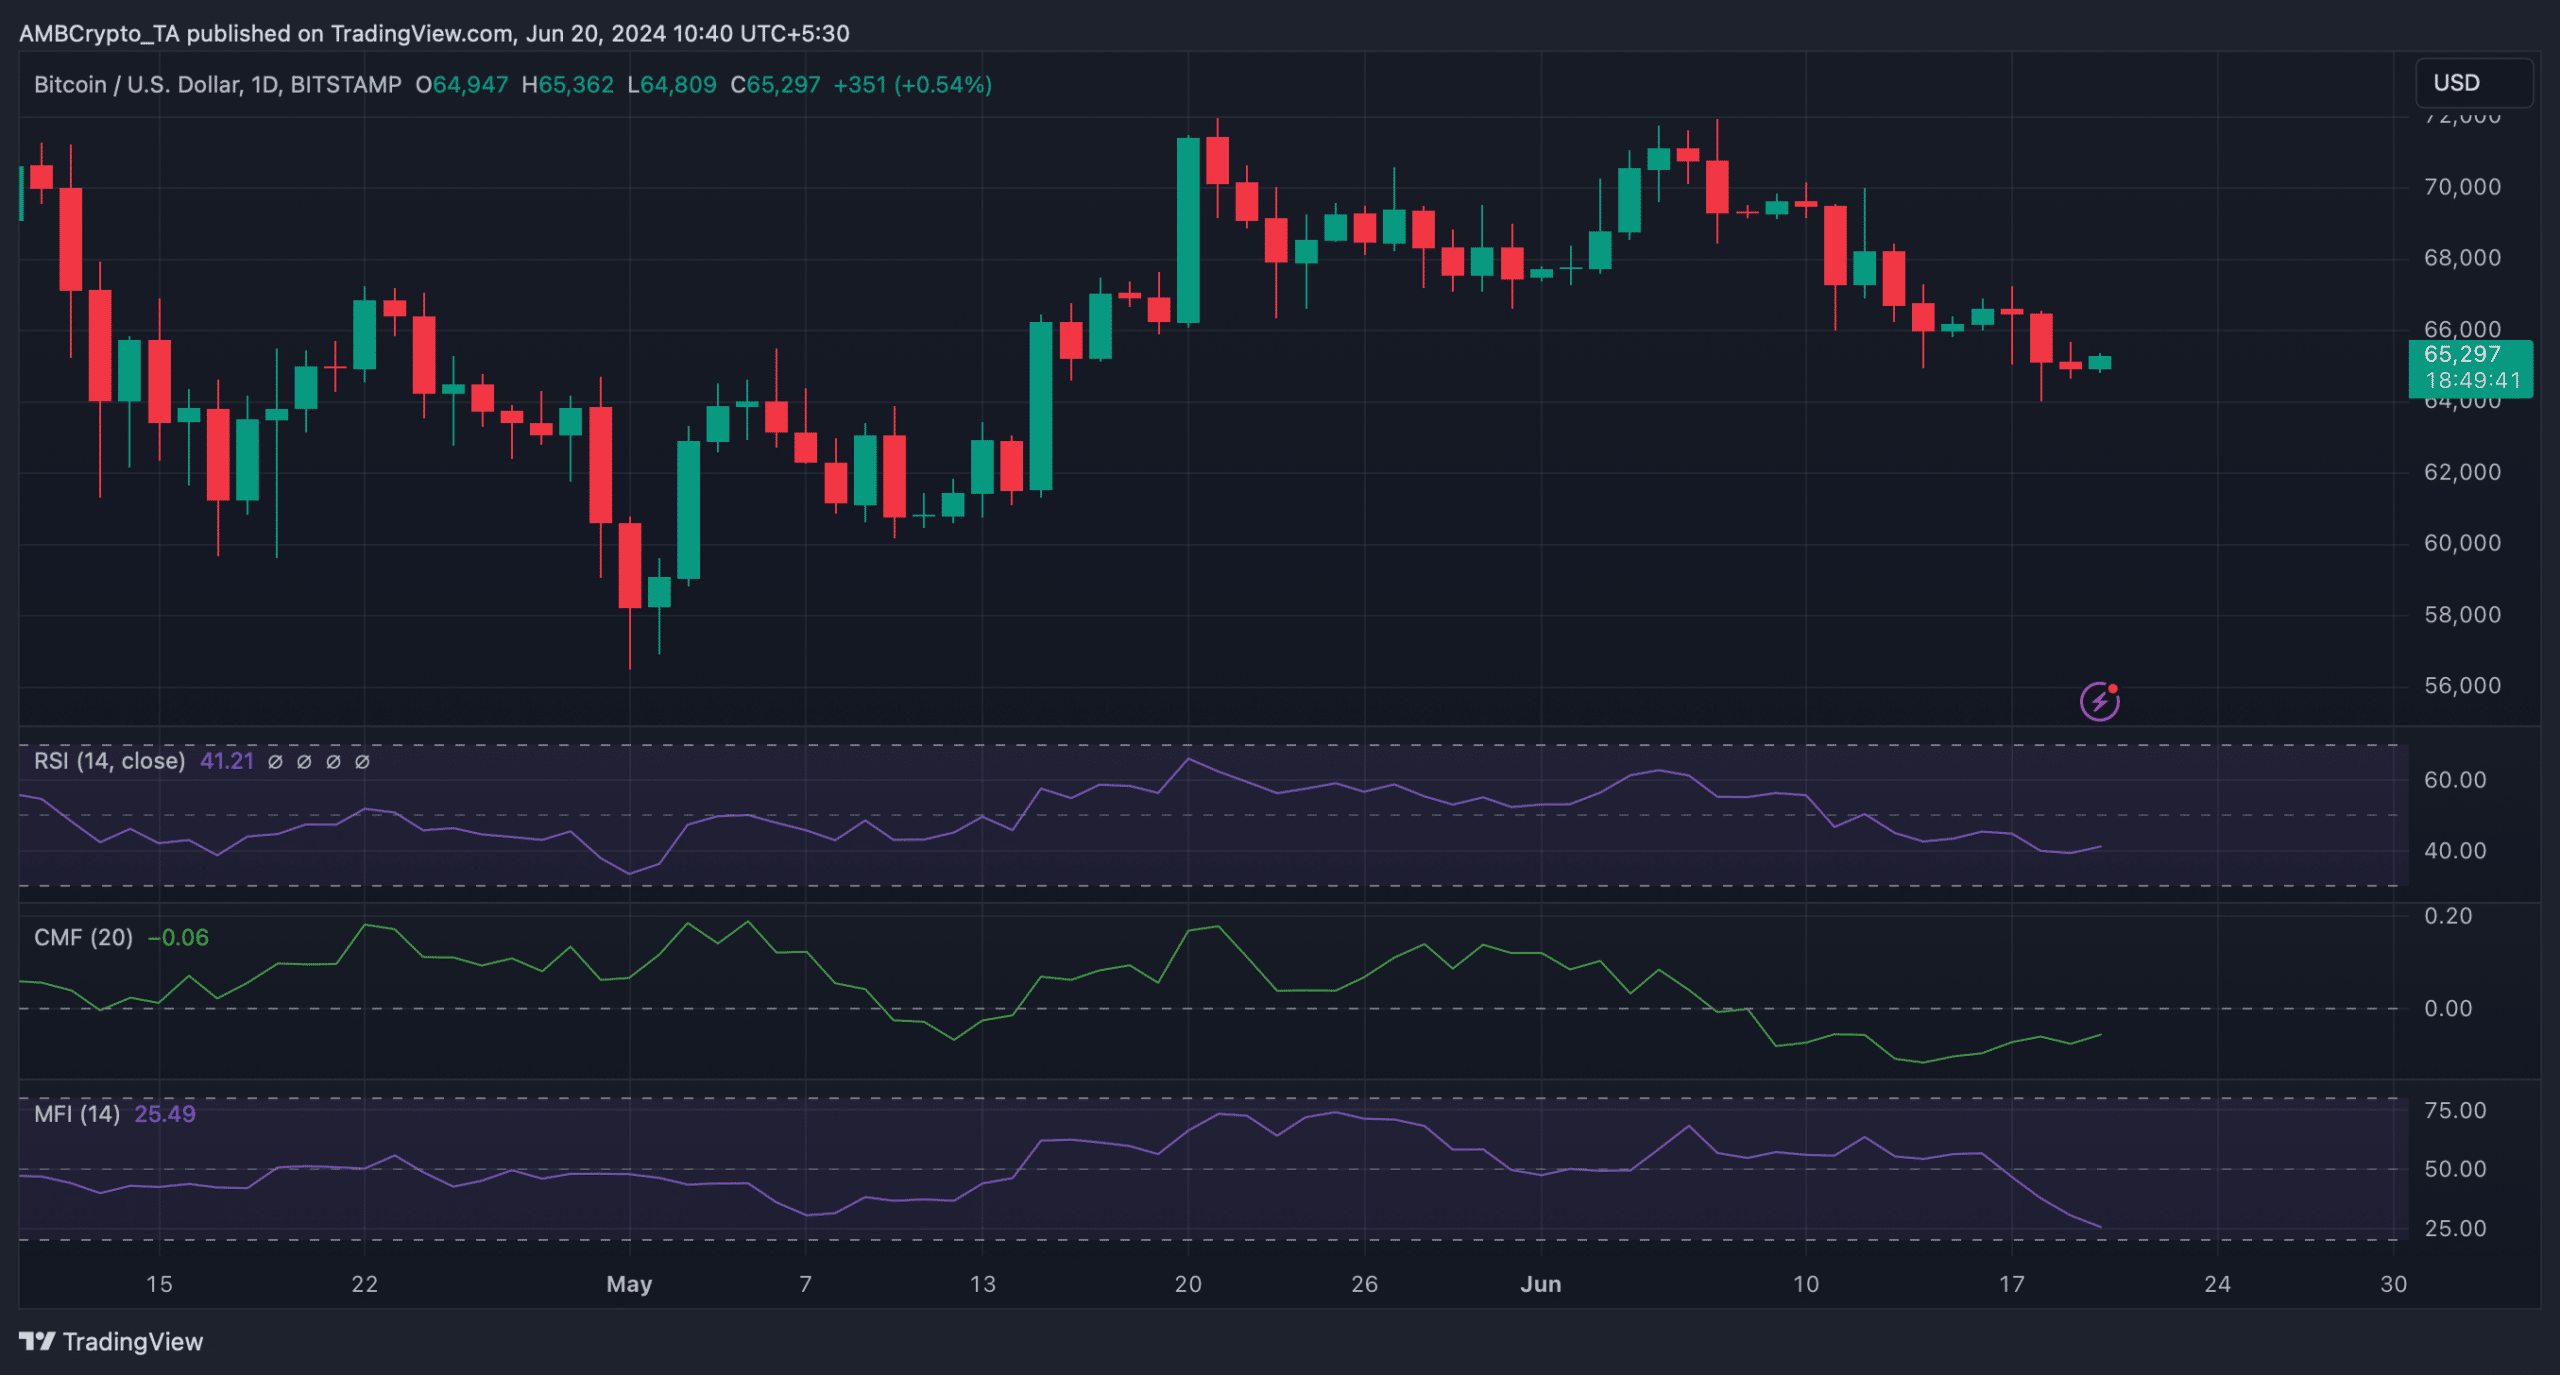
Source: TradingView


