
- While ETH’s price dropped, whales deposited tokens worth millions of dollars
- Few metrics and indicators suggested that ETH was undervalued
As the crypto market witnessed a crash last week, the king of altcoins, Ethereum [ETH], also fell victim to a massive price correction. Because of the price decline, many might have lost confidence in the token. However, the trend changed over the last few hours as ETH’s daily chart soon turned green.
Ethereum’s high volatility
CoinMarketCap’s data revealed that ETH’s price had dropped by more than 12% in just seven days. AMBCrypto’s assessment of IntoTheBlock’s data also revealed that ETH’s average balance dropped, which can be attributed to the token’s double-digit price decline.
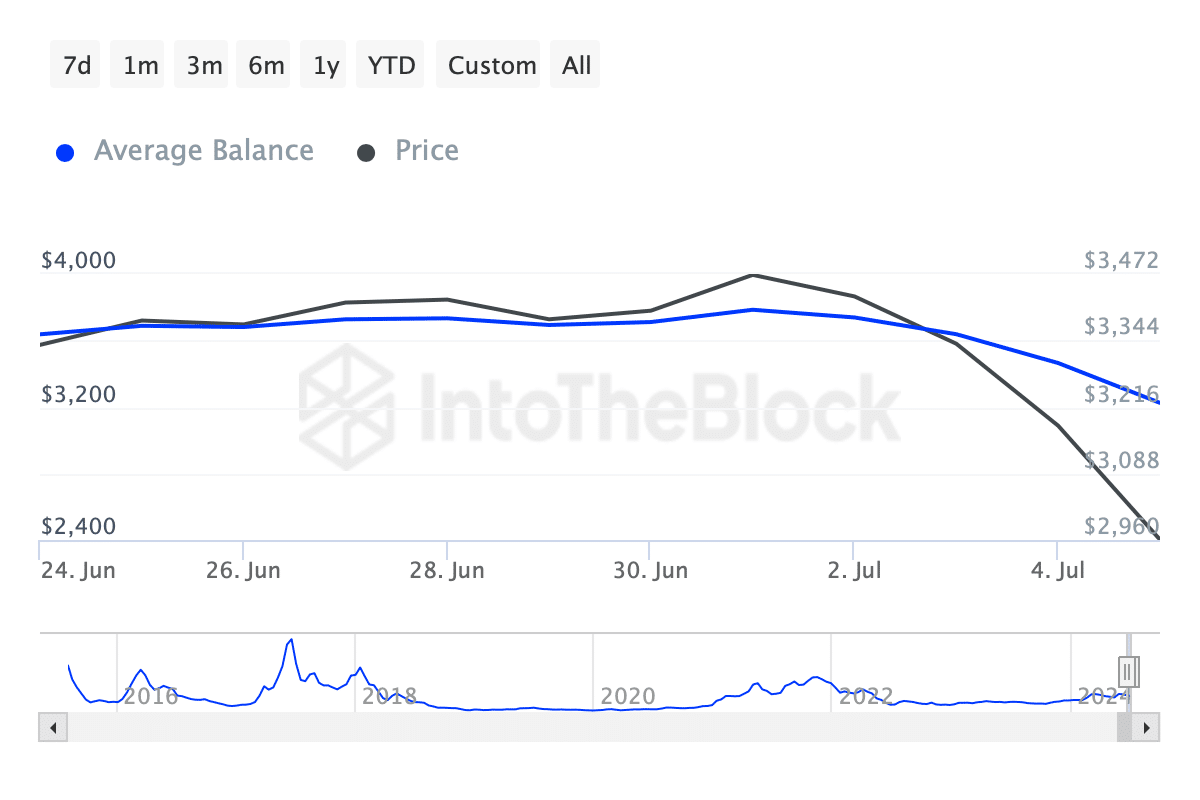
Source: IntoTheBlock
In the meantime, Lookonchain posted a tweet sharing an interesting development. According to the same, several whales started to sell ETH as its value fell. To be precise, three Ethereum whales deposited 28,558 ETH, worth over $82.2 million, to Binance. Soon after though, ETH’s price registered a trend reversal on the charts.
In fact, the altcoin’s price has appreciated by nearly 3% in the last 24 hours alone. At the time of writing, ETH was trading at $2,967.81 with a market capitalization of over $356 billion.
However, despite the rise in price, its trading volume dropped by double digits. This suggested that ETH might not sustain its bullish momentum for long.
Will ETH’s bull rally last?
Like the trading volume, a few other metrics also looked pretty bearish.
For instance, though ETH recorded a price hike, selling pressure on the token continued to remain high. This was evidenced by looking at CryptoQuant’s data, with the same highlighting a rise in ETH’s exchange reserves. Simply put, several investors chose to sell.
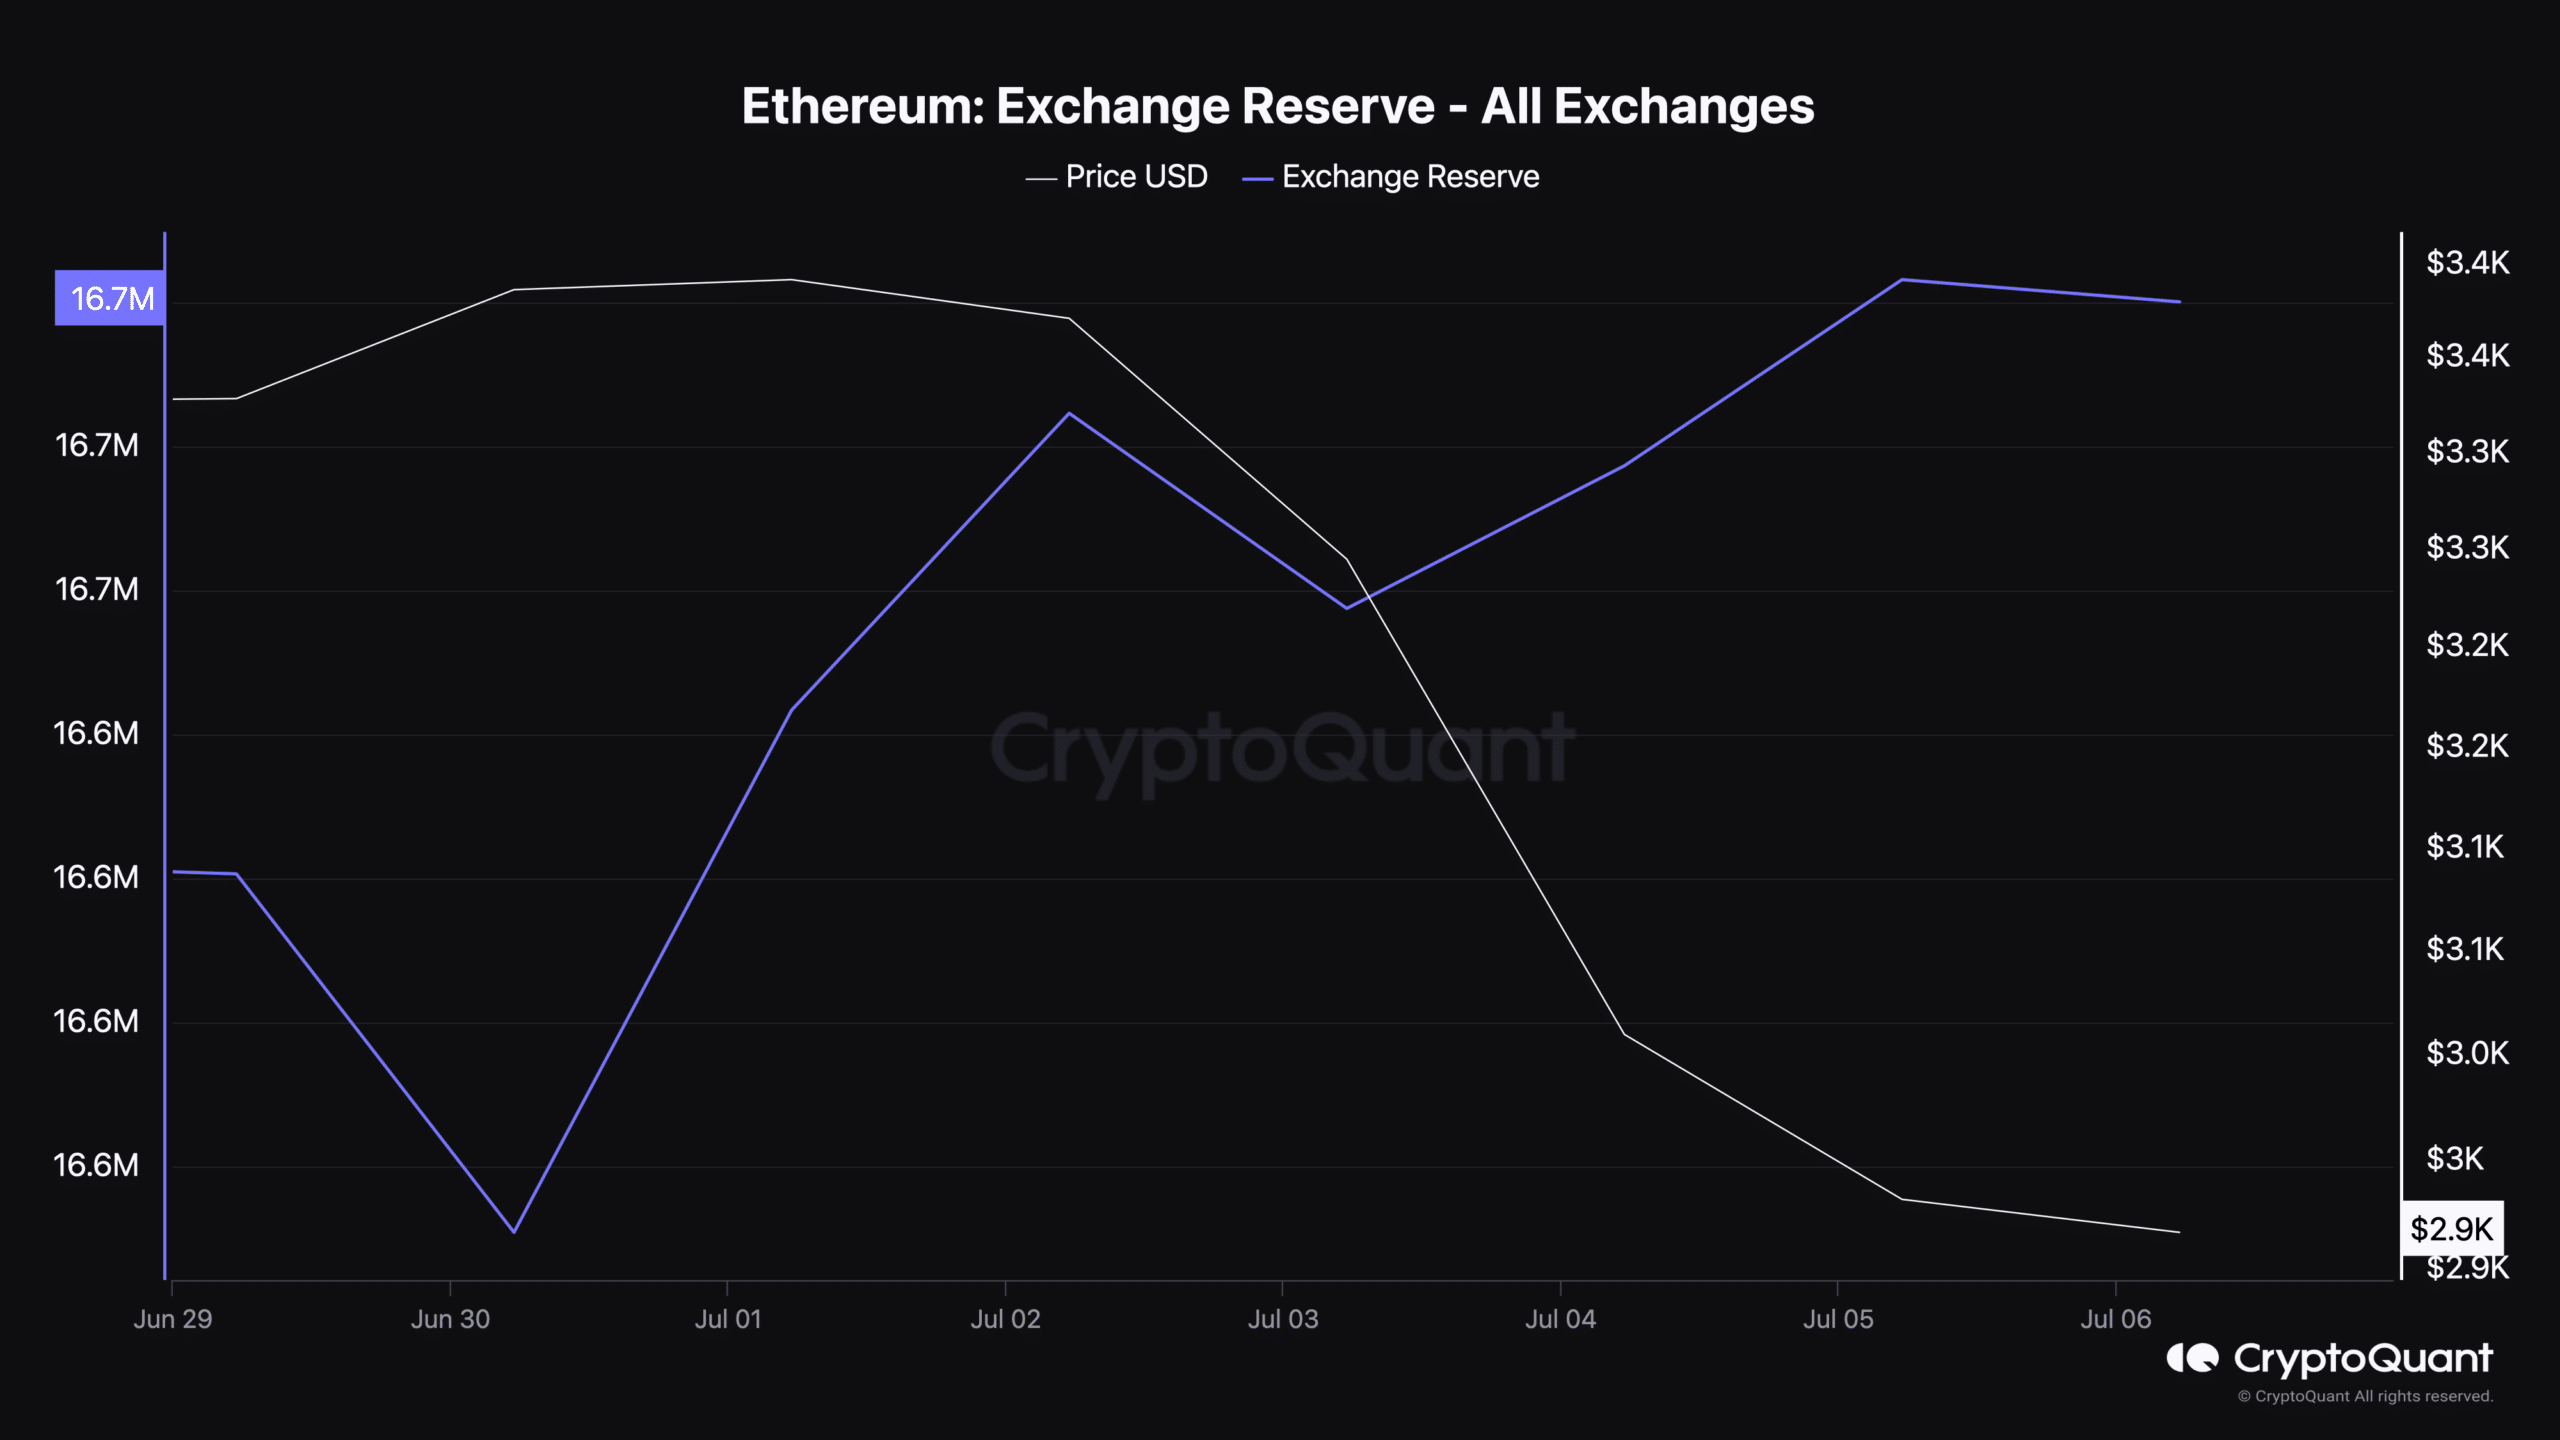
Source: CryptoQuant
Nonetheless, other metrics supported the possibility of a sustained uptrend as well.
For example – ETH’s funding rate has been rising, meaning that long-position traders have been dominant and may be willing to pay short-position traders. Its Relative Strength Index (RSI), as per CryptoQuant, was in the oversold zone too. This might help increase buying pressure in the coming days, which might in turn result in a price hike on the charts.
On top of that, AMBCrypto’s analysis of Glassnode’s data revealed that EThereum’s NVT ratio dropped sharply. A fall in this metric means that an asset is undervalued, which is generally followed by price hikes.
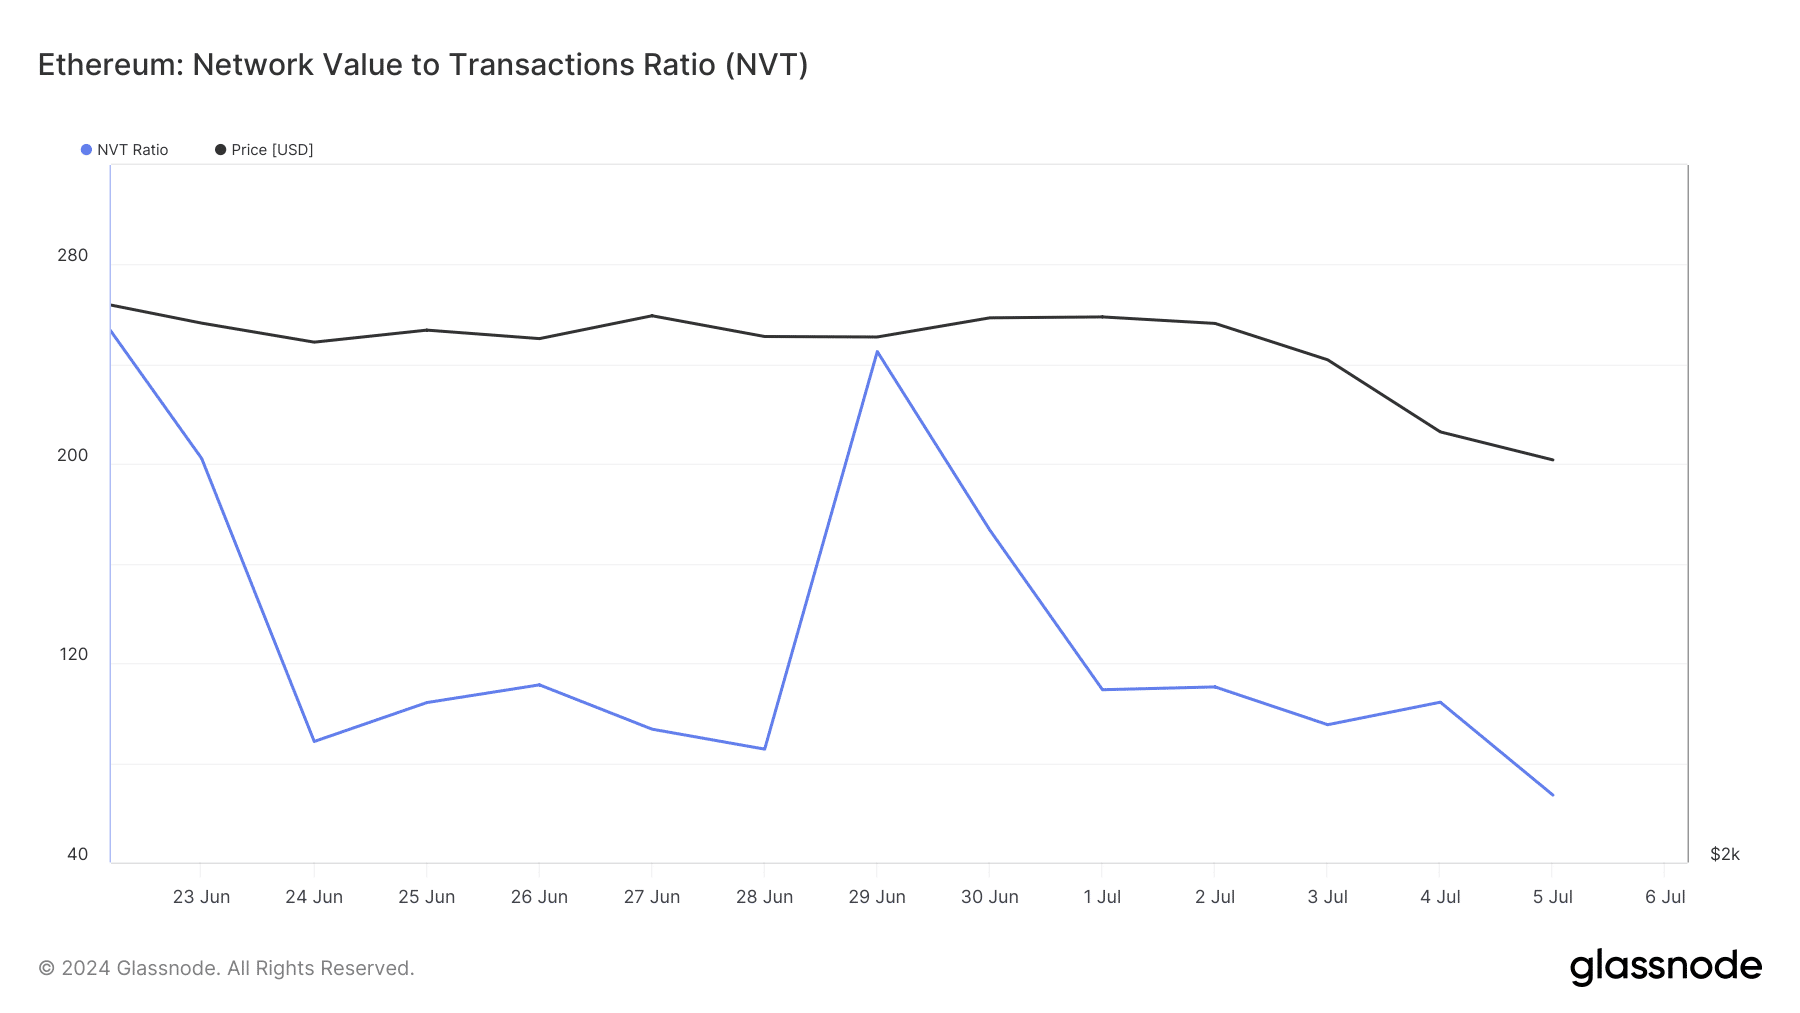
Source: Glassnode
We then planned to have a look at ETH’s daily chart to better understand what to expect. We found that ETH’s price touched the lower limit of the Bollinger Bands – Underlining the chances of a rebound.
Read Ethereum’s [ETH] Price Prediction 2024-25
Additionally, its Money Flow Index (MFI) was also about to enter the oversold zone.
However, the Chaikin Money Flow (CMF) looked bearish, as at press time it had a value of -0.09.
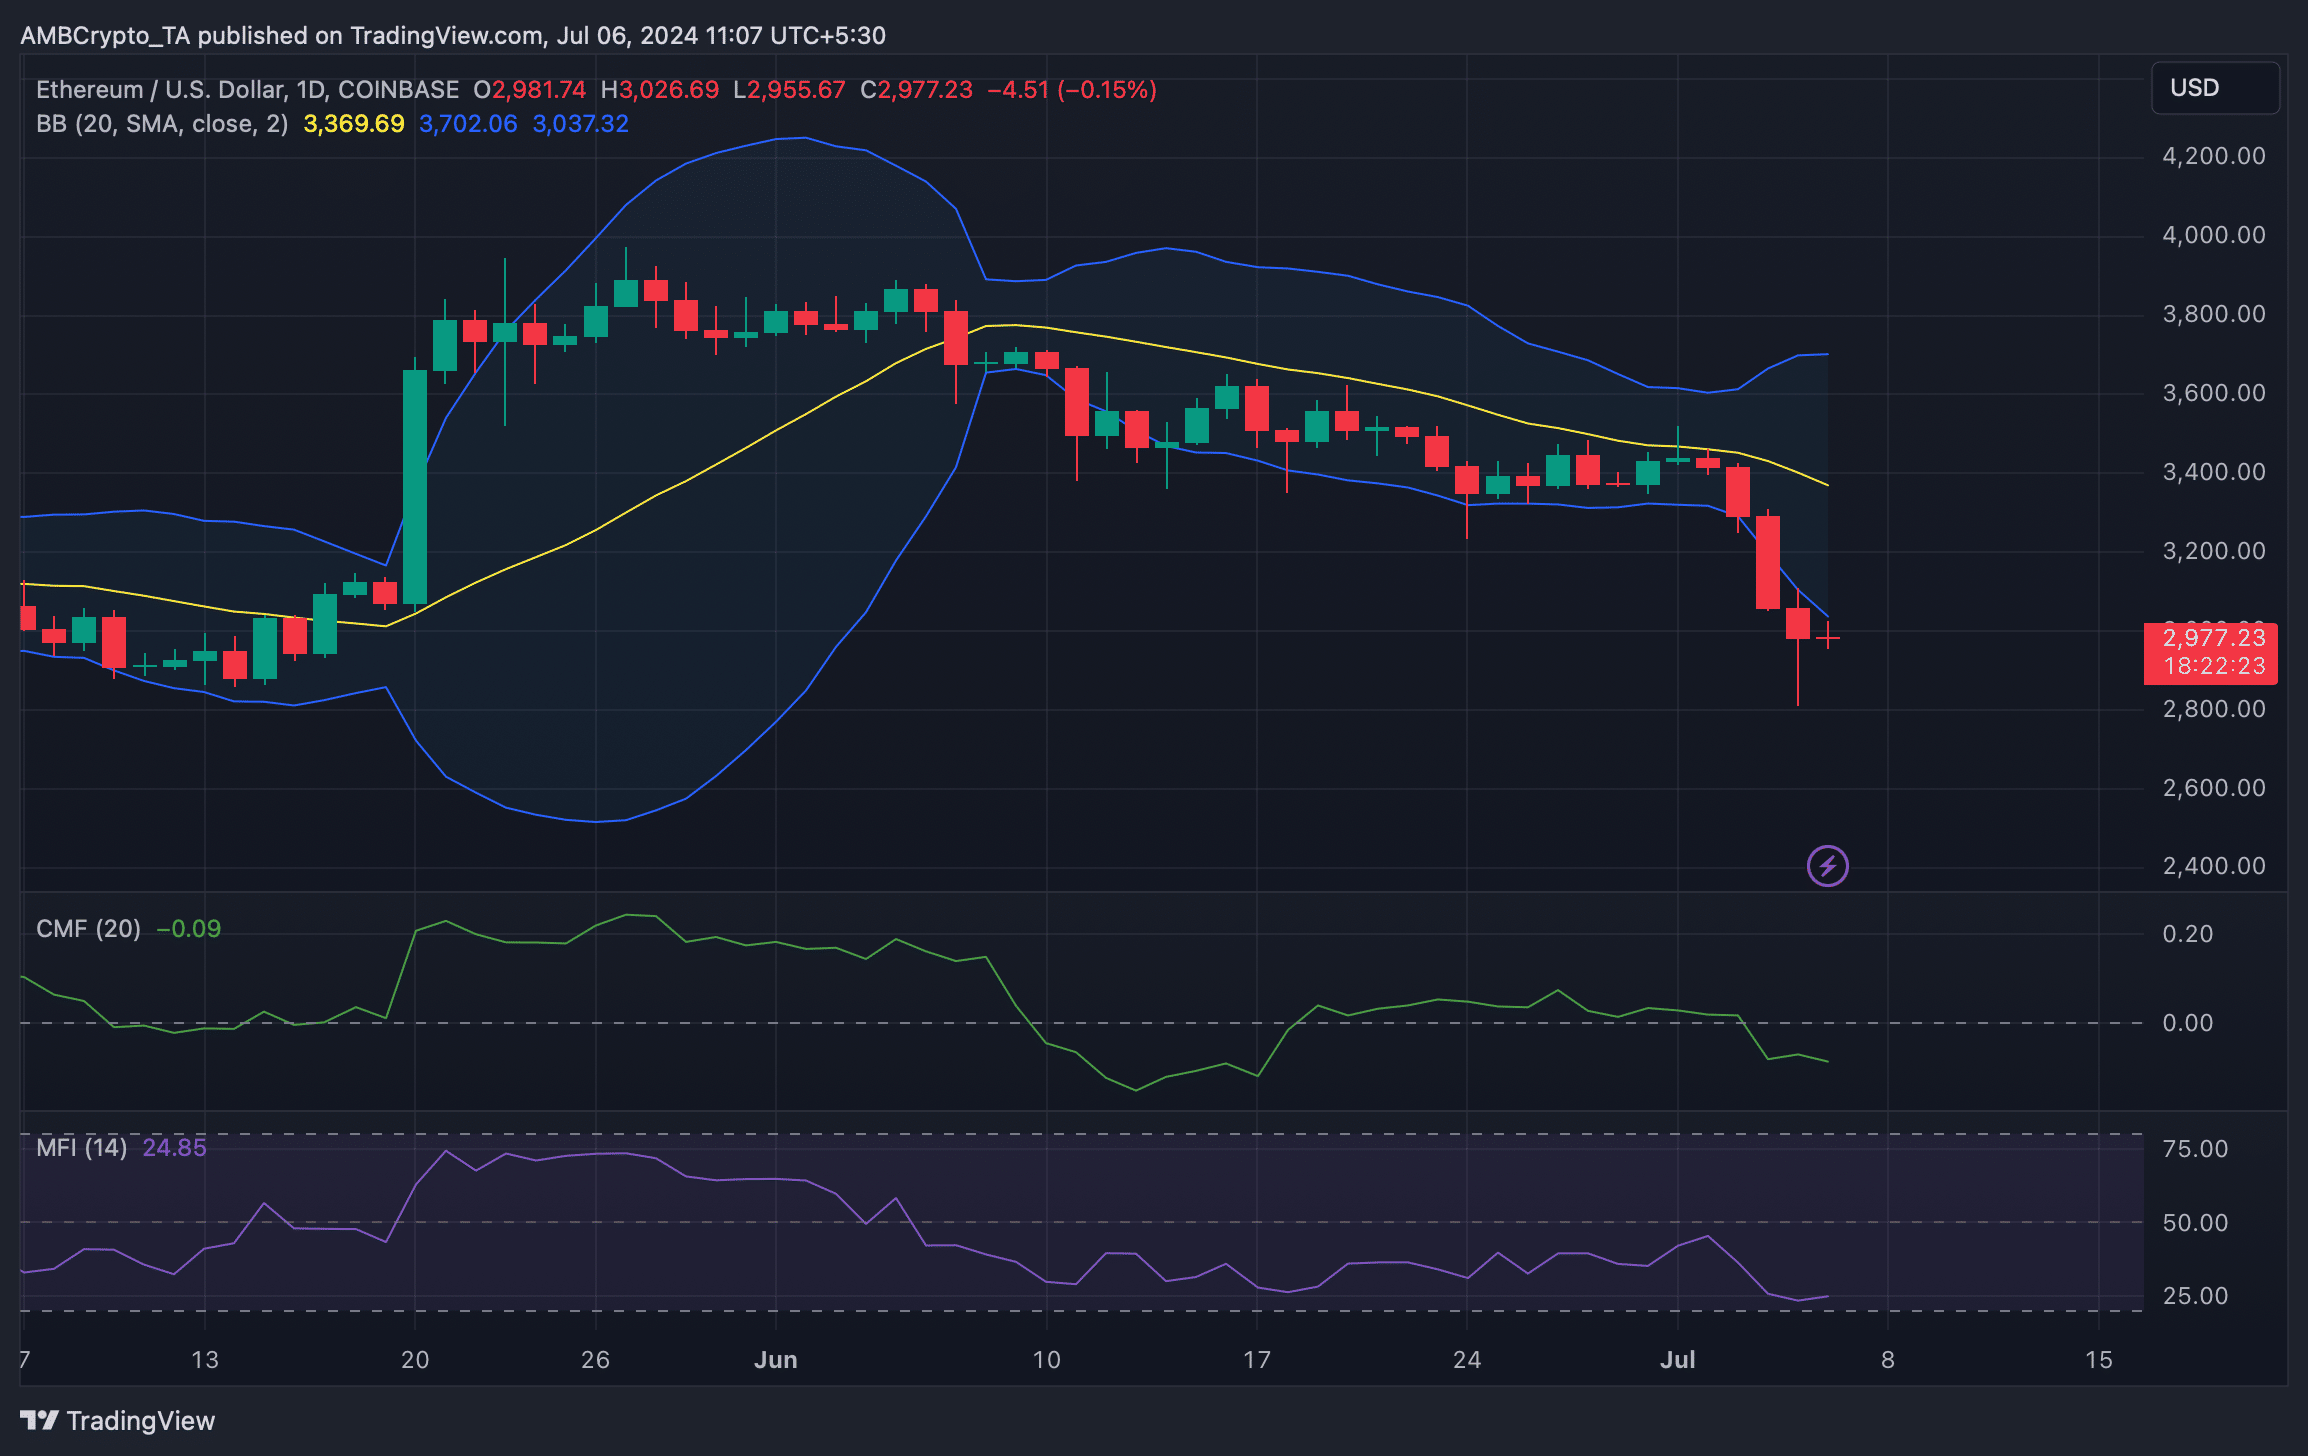
Source: TradingView