Solana consolidates, but SOL can still reach $200 – Here’s how

- Solana traded within a defined consolidation range, indicating upcoming growth.
- The 200-day EMA and Fibonacci levels suggested key support and resistance points.
In recent trading sessions, Solana [SOL] has been experiencing significant fluctuations in its market value. From a high of $172 last week, the digital asset has seen a correction, stabilizing around $151 at the time of writing.
This movement represented a modest increase of 0.1% in the last 24 hours. Such market behavior underscored a critical phase of price consolidation that could set the stage for future price dynamics.
Solana: Market predictions
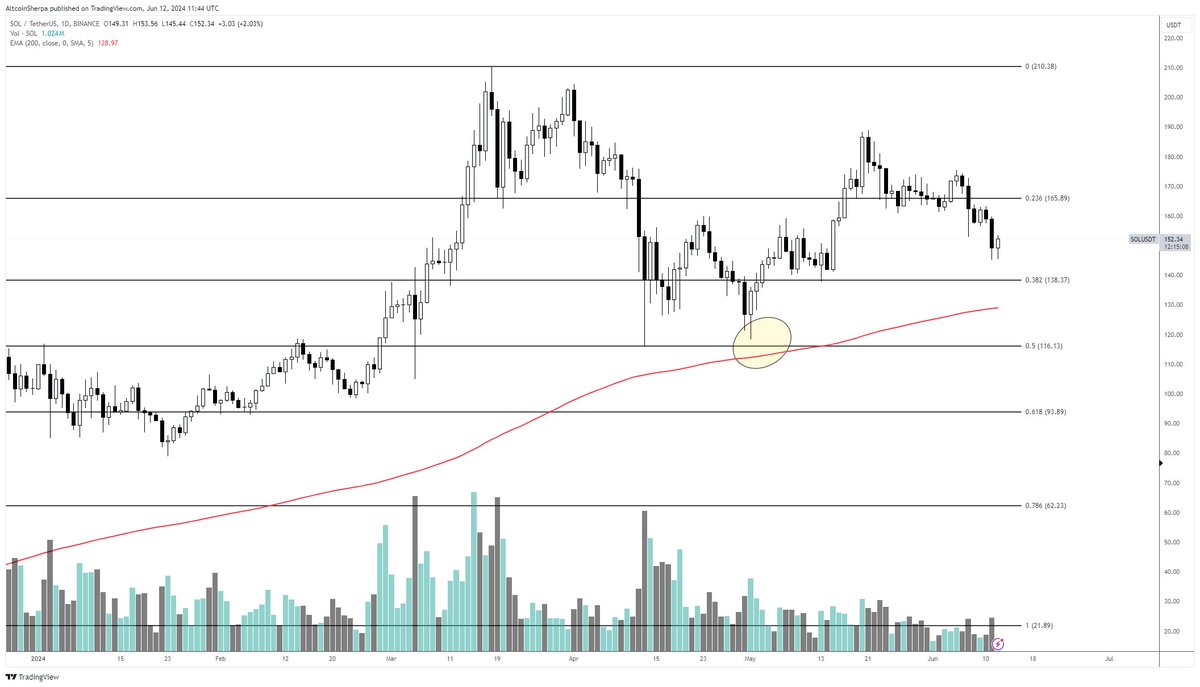
Crypto analyst Altcoin Sherpa has provided a perspective on Solana’s current market performance, pointing to a consolidation range between $185 and $120.
This range, according to Sherpa, indicated a period of market balance following a rapid price increase. Such phases are not uncommon and are often indicative of a market preparing for its next significant move.
The 200-day exponential moving average (EMA) is a technical analysis tool used to smooth out price data by creating a constantly updated average price over 200 days.
The EMA is crucial for identifying the overall market trend and potential support levels. Approaching this average suggests a near-term support level that might encourage buying activities among traders.
Further technical analysis from Sherpa using Fibonacci retracement highlighted critical support and resistance levels.
At press time, the 0.382 retracement level was approximately $138.37, potentially serving as a pivotal point for Solana’s price.
If the price descends below this mark, the subsequent levels—0.5 and 0.618—are likely to act as further thresholds where price stabilization or a reversal could occur.
Fundamental analysis
Despite the ongoing consolidation, recent activities in Solana’s network could hint at underlying strengths.
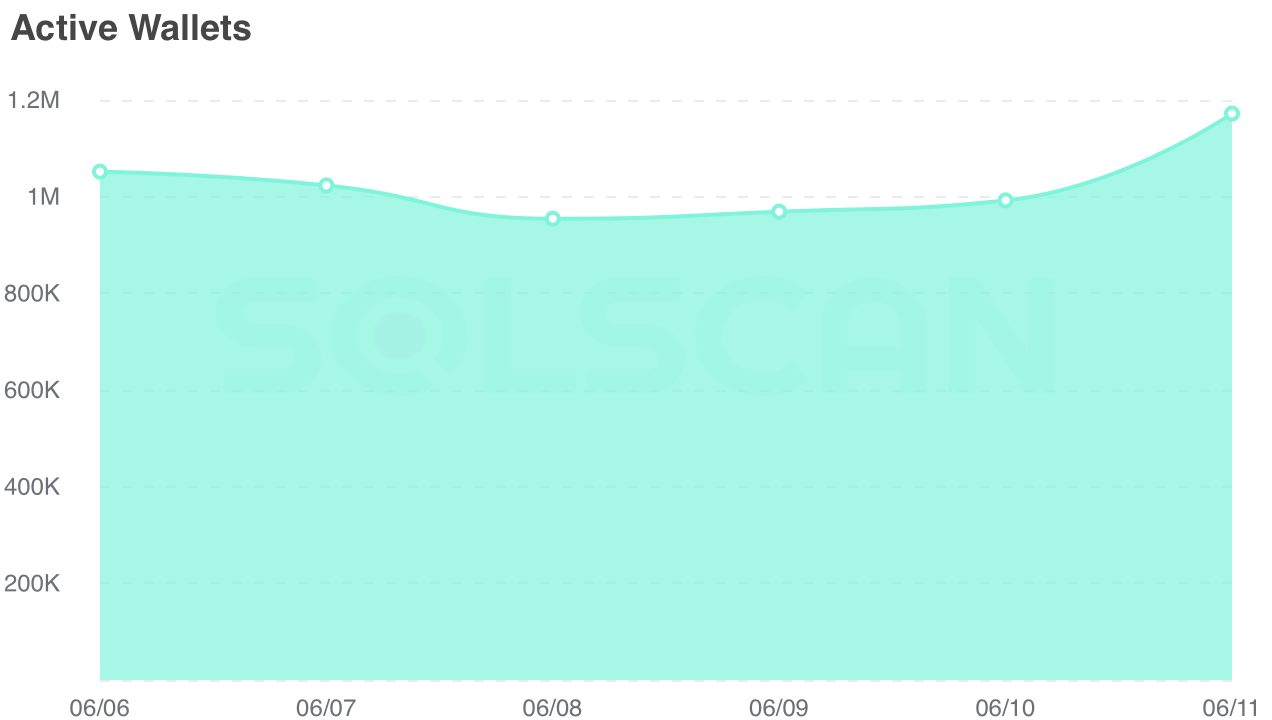
For instance, the number of active addresses on the Solana network has surged, climbing from less than a million to over 1.1 million in just a week.
This increase in active addresses usually signals a growing user engagement or preparatory activities for upcoming transactions, which could lead to increased demand for SOL.
In terms of market derivatives, Solana’s Open Interest—representing the total number of outstanding derivative contracts, such as options or Futures that have not been settled—showed an intriguing pattern.
While there has been a slight decrease in Open Interest by about 3%, the Open Interest volume has surged by 19.54%.
This suggested that while fewer contracts were open, the remaining ones involved larger volumes, pointing to heightened market activity and potential anticipation of significant price moves.
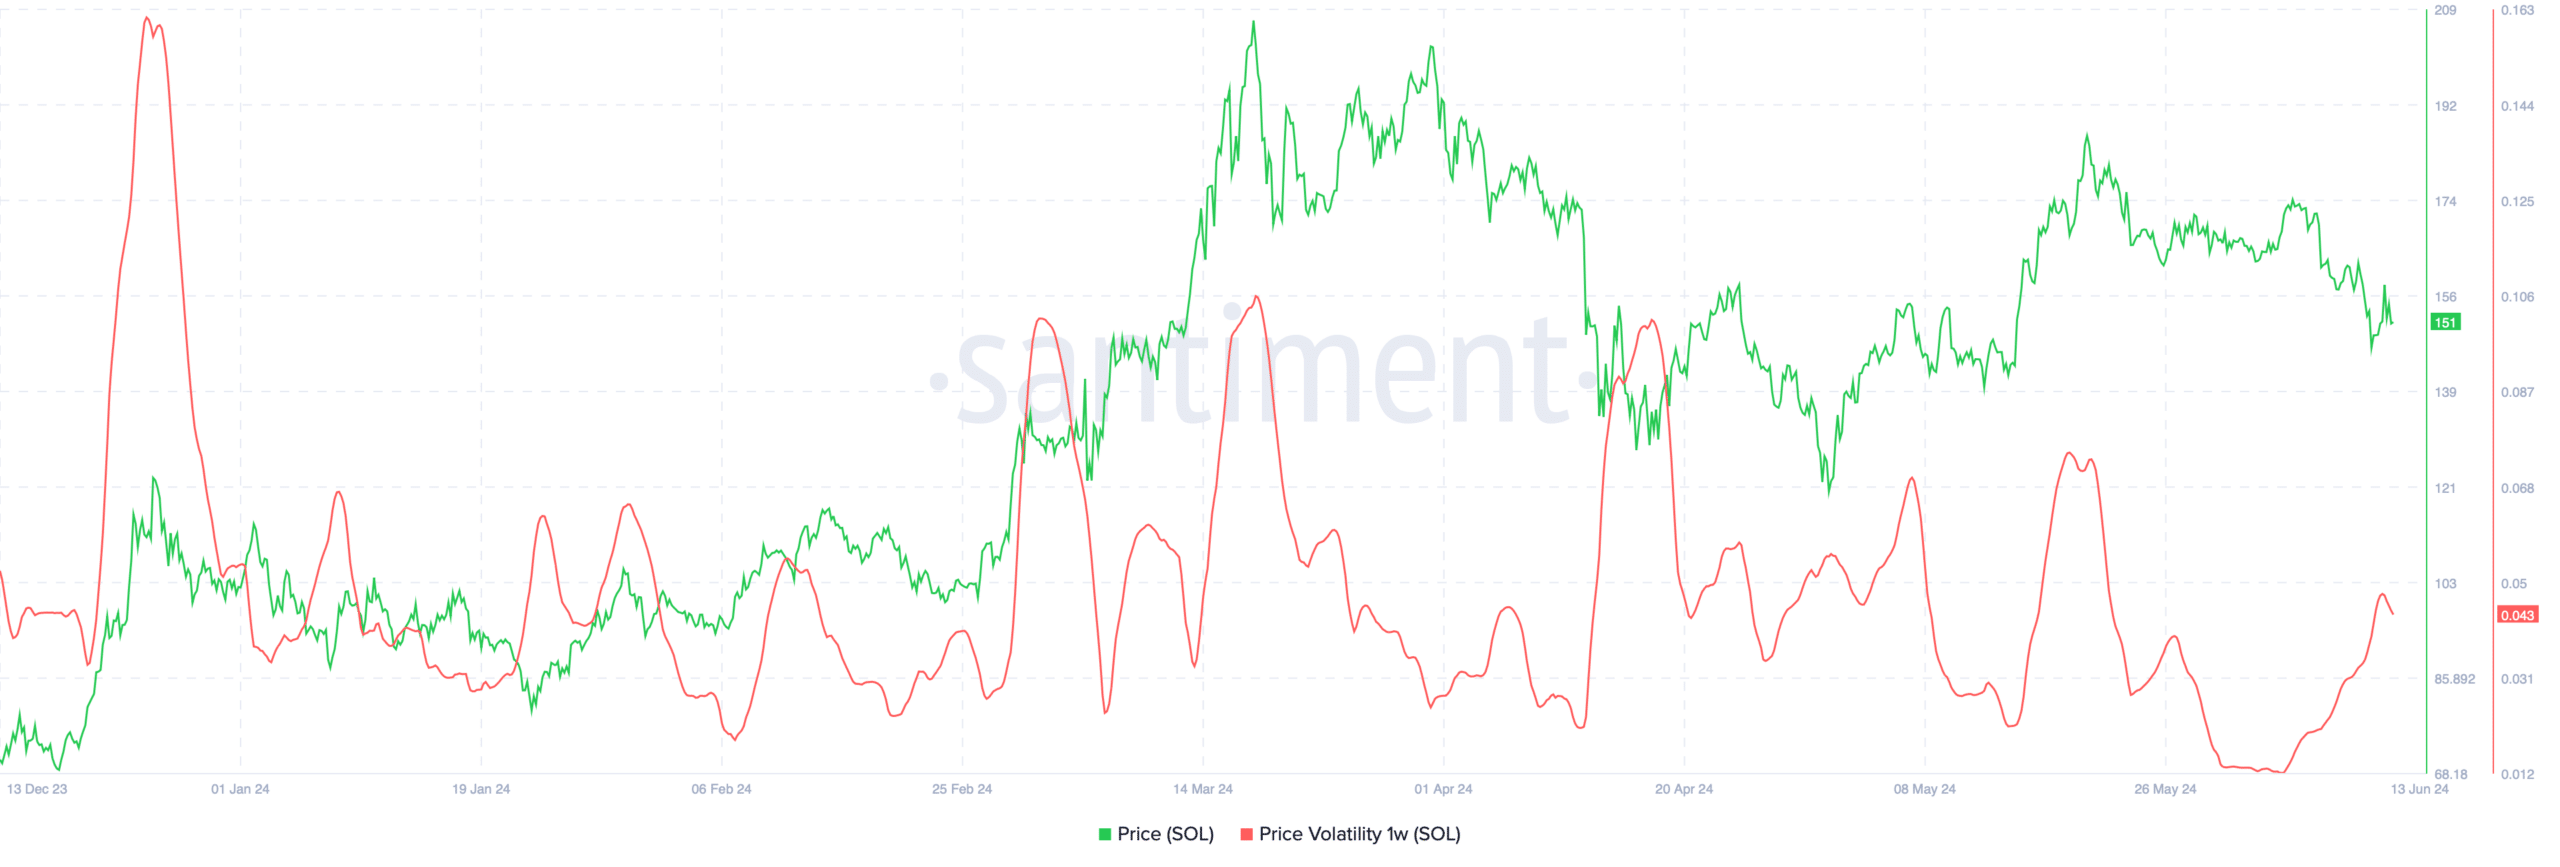
There has also been a recent spike in Solana’s price volatility, according to Santiment.
Volatility indicates the degree of variation in trading prices, with higher volatility often leading to broader price swings, which can create opportunities for traders.
Is your portfolio green? Check out the SOL Profit Calculator
Meanwhile, AMBCrypto recently reported that the Money Flow Index (MFI) and Relative Strength Index (RSI) have shown recent upticks for Solana, suggesting increased buying pressure and potential for price increase.
Conversely, the Chaikin Money Flow (CMF) remained in a bearish zone, indicating that while buying pressure is up, the overall money flow into Solana could be better, presenting a mixed sentiment among investors.


