777,000 Ethereum moved post-ETF approval: Impact on ETH?

- Ethereum’s price had dropped by over 2% in the last seven days
- A metric indicated that ETH was overvalued
Ethereum [ETH] created much buzz in the crypto space when the US Securities and Exchange Commission gave approval to ETH ETFs. Though ETH’s price didn’t turn bullish after the approval, things could change in the coming days.
Is buying pressure high?
Before ETFs got approval, there was much anticipation and hype around it. During that time, ETH’s price action also turned volatile in a northward direction.
However, after the proposal was passed, things cooled down. In fact, Ethereum has struggled over the last few days.
According to CoinMarketCap, ETH was down by more than 2% in the last seven days. At the time of writing, the king of altcoins was trading at $3,814.82 with a market capitalization of over $458 billion.
In the meantime, Ali, a popular crypto analyst, recently posted a tweet highlighting an interesting development.
As per the tweet, approximately 777,000 ETH, which was valued at about $3 billion, have been withdrawn from crypto exchanges since the ETF approval. This indicated high buying pressure, which might also have a positive impact on the token’s price.
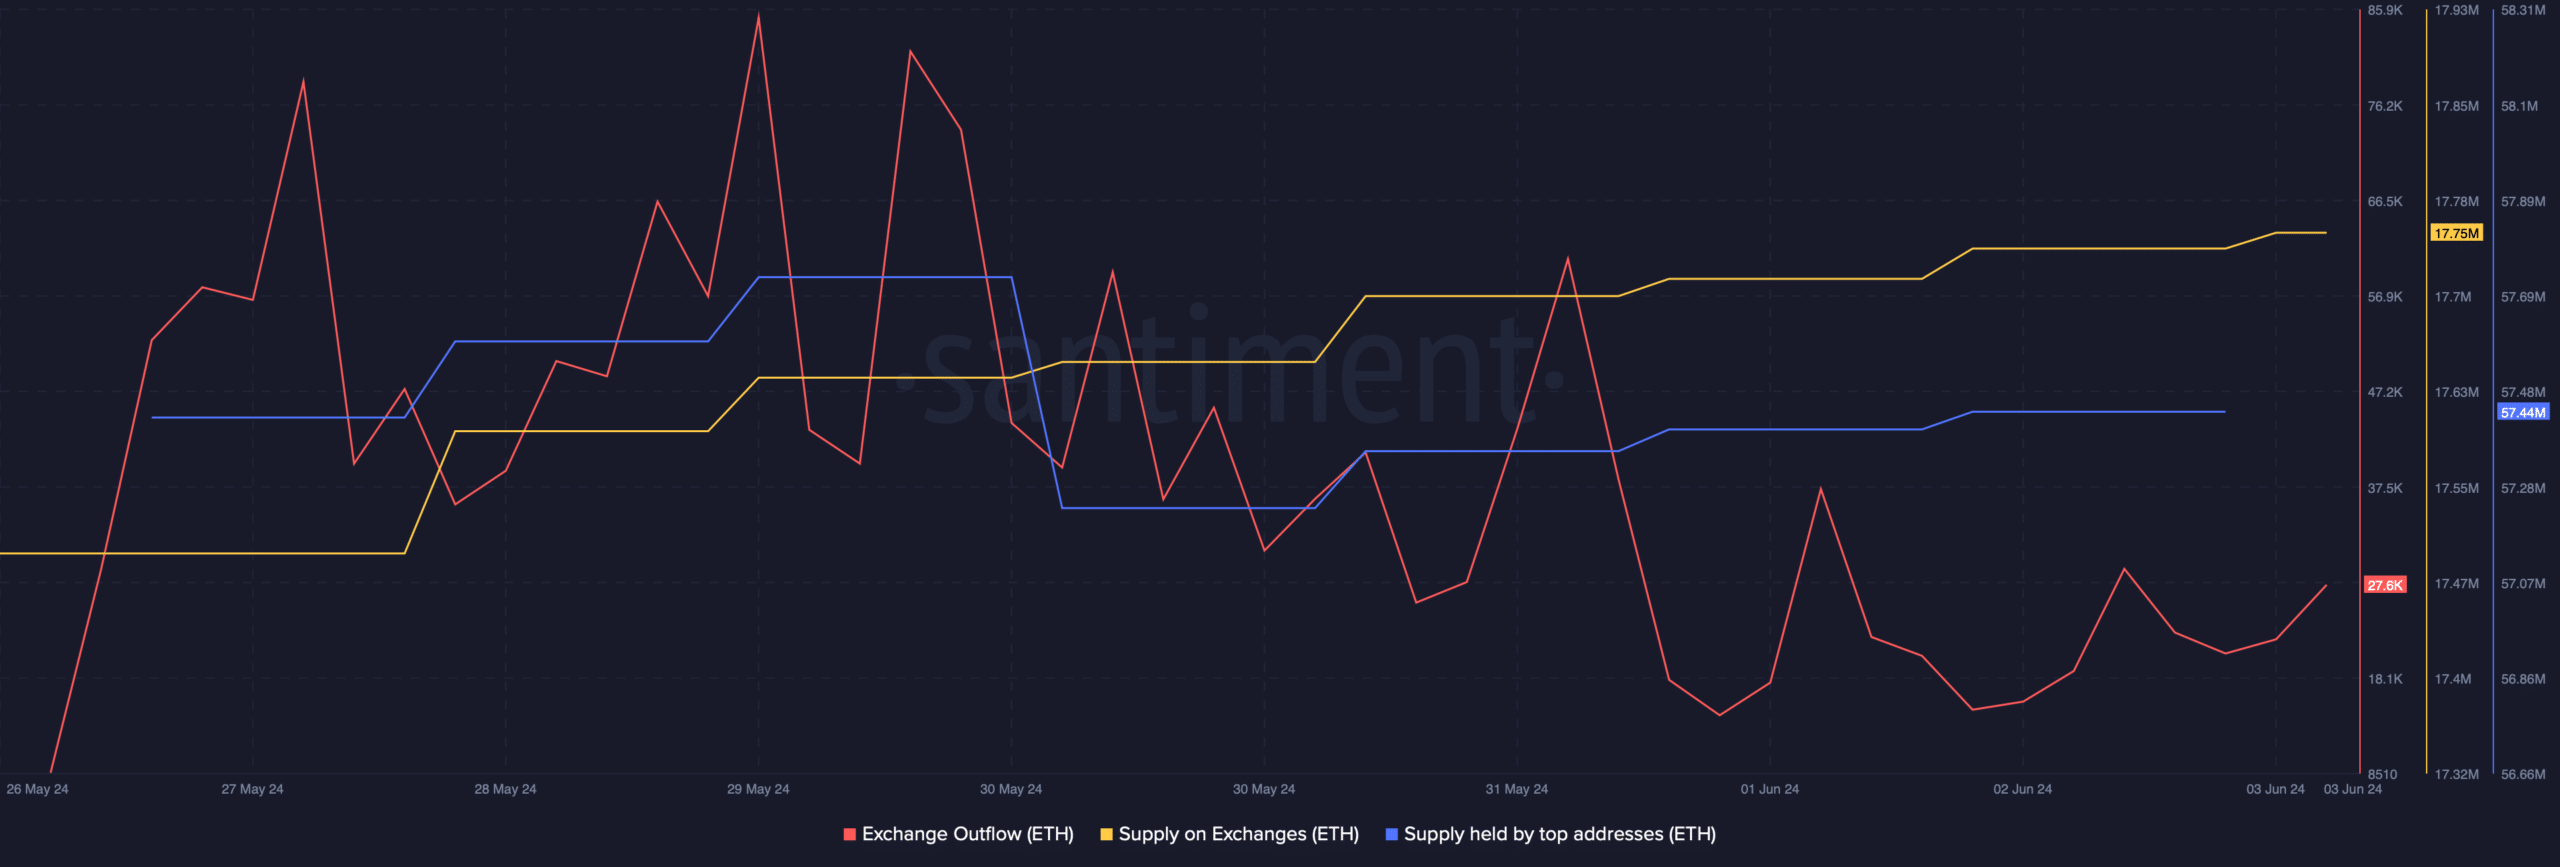
Therefore, AMBCrypto analyzed its on-chain metrics to see whether buying pressure was actually high. AMBCrypto’s analysis of Santiment’s data revealed that Ethereum’s exchange outflow dropped last week.
Its supply on exchanges increased, meaning that investors were rather selling ETH.
On top of that, the token’s supply held by top addresses also dropped slightly last week. This meant that whales were also selling ETH as it struggled to touch $4k.
Looking forward
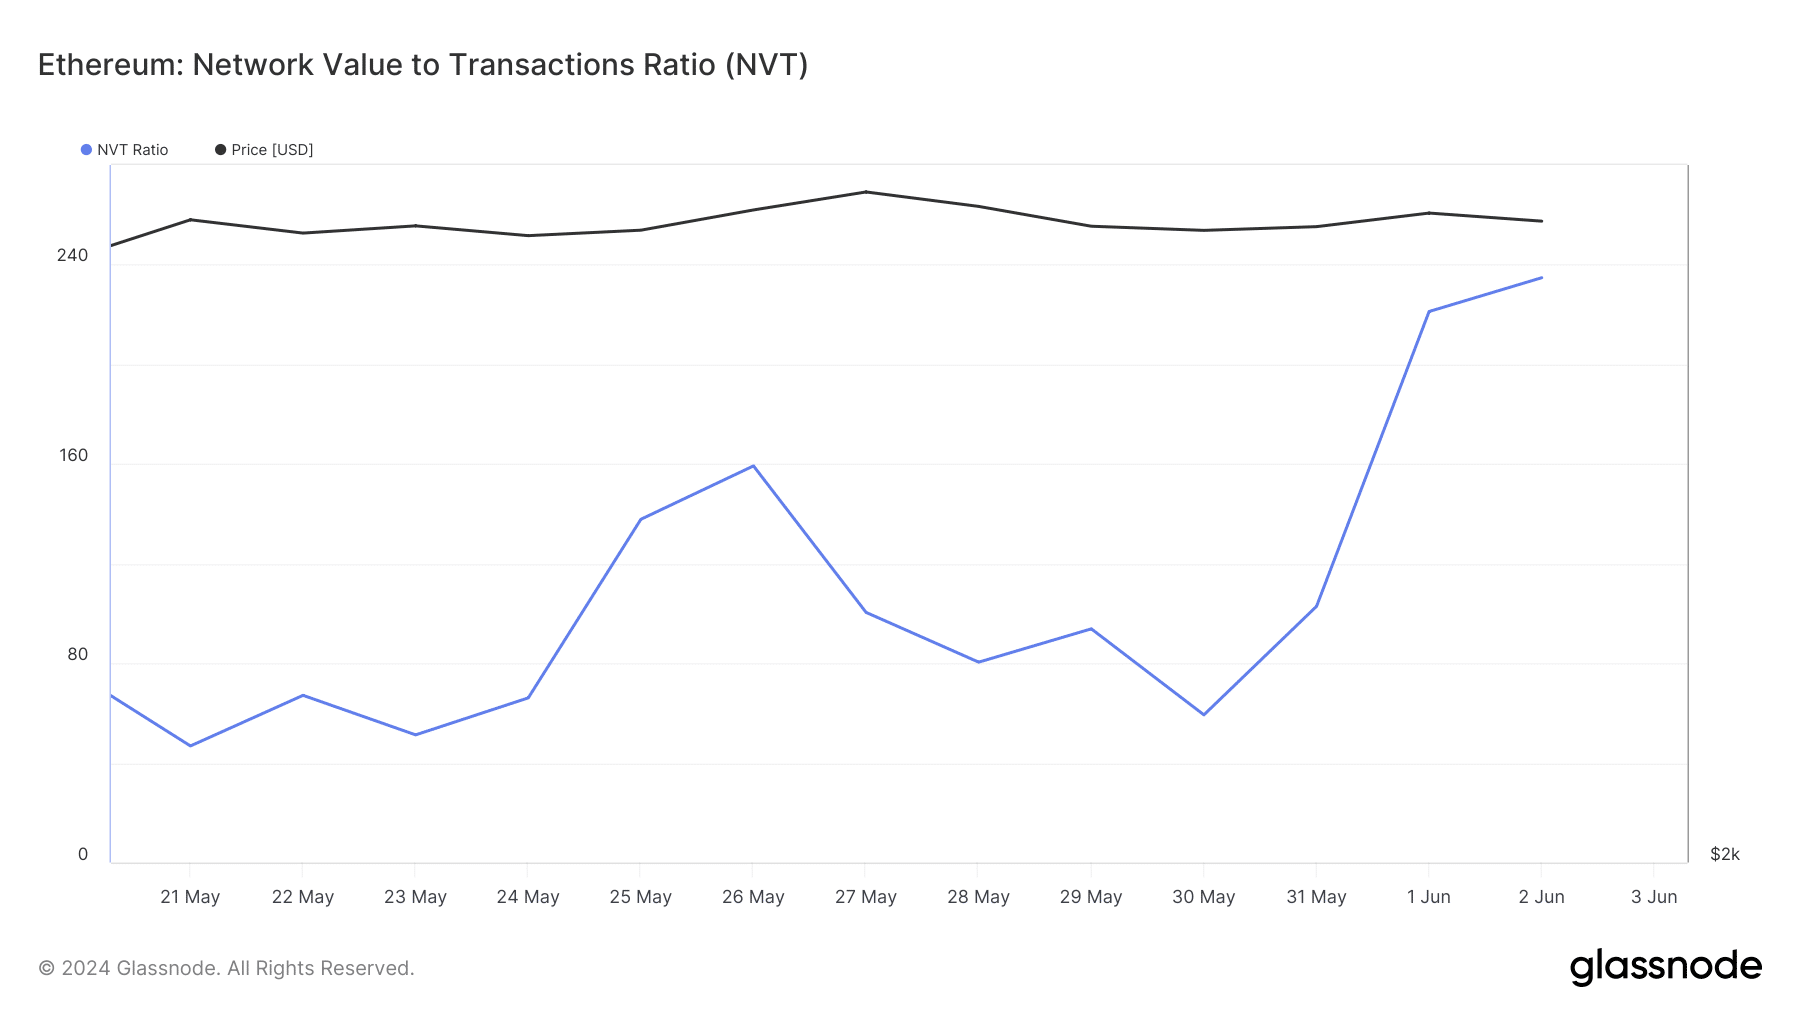
While selling pressure increased, a key metric turned bearish on the token. Our analysis of Glassnode’s data revealed that Ethereum’s NVT ratio registered a sharp uptick on the 1st of June.
For starters, the metric is computed by dividing the market cap by the transferred on-chain volume measured in USD.
Whenever the metric rises, it indicates that an asset is overvalued. This suggested that the chances of a price correction were high.
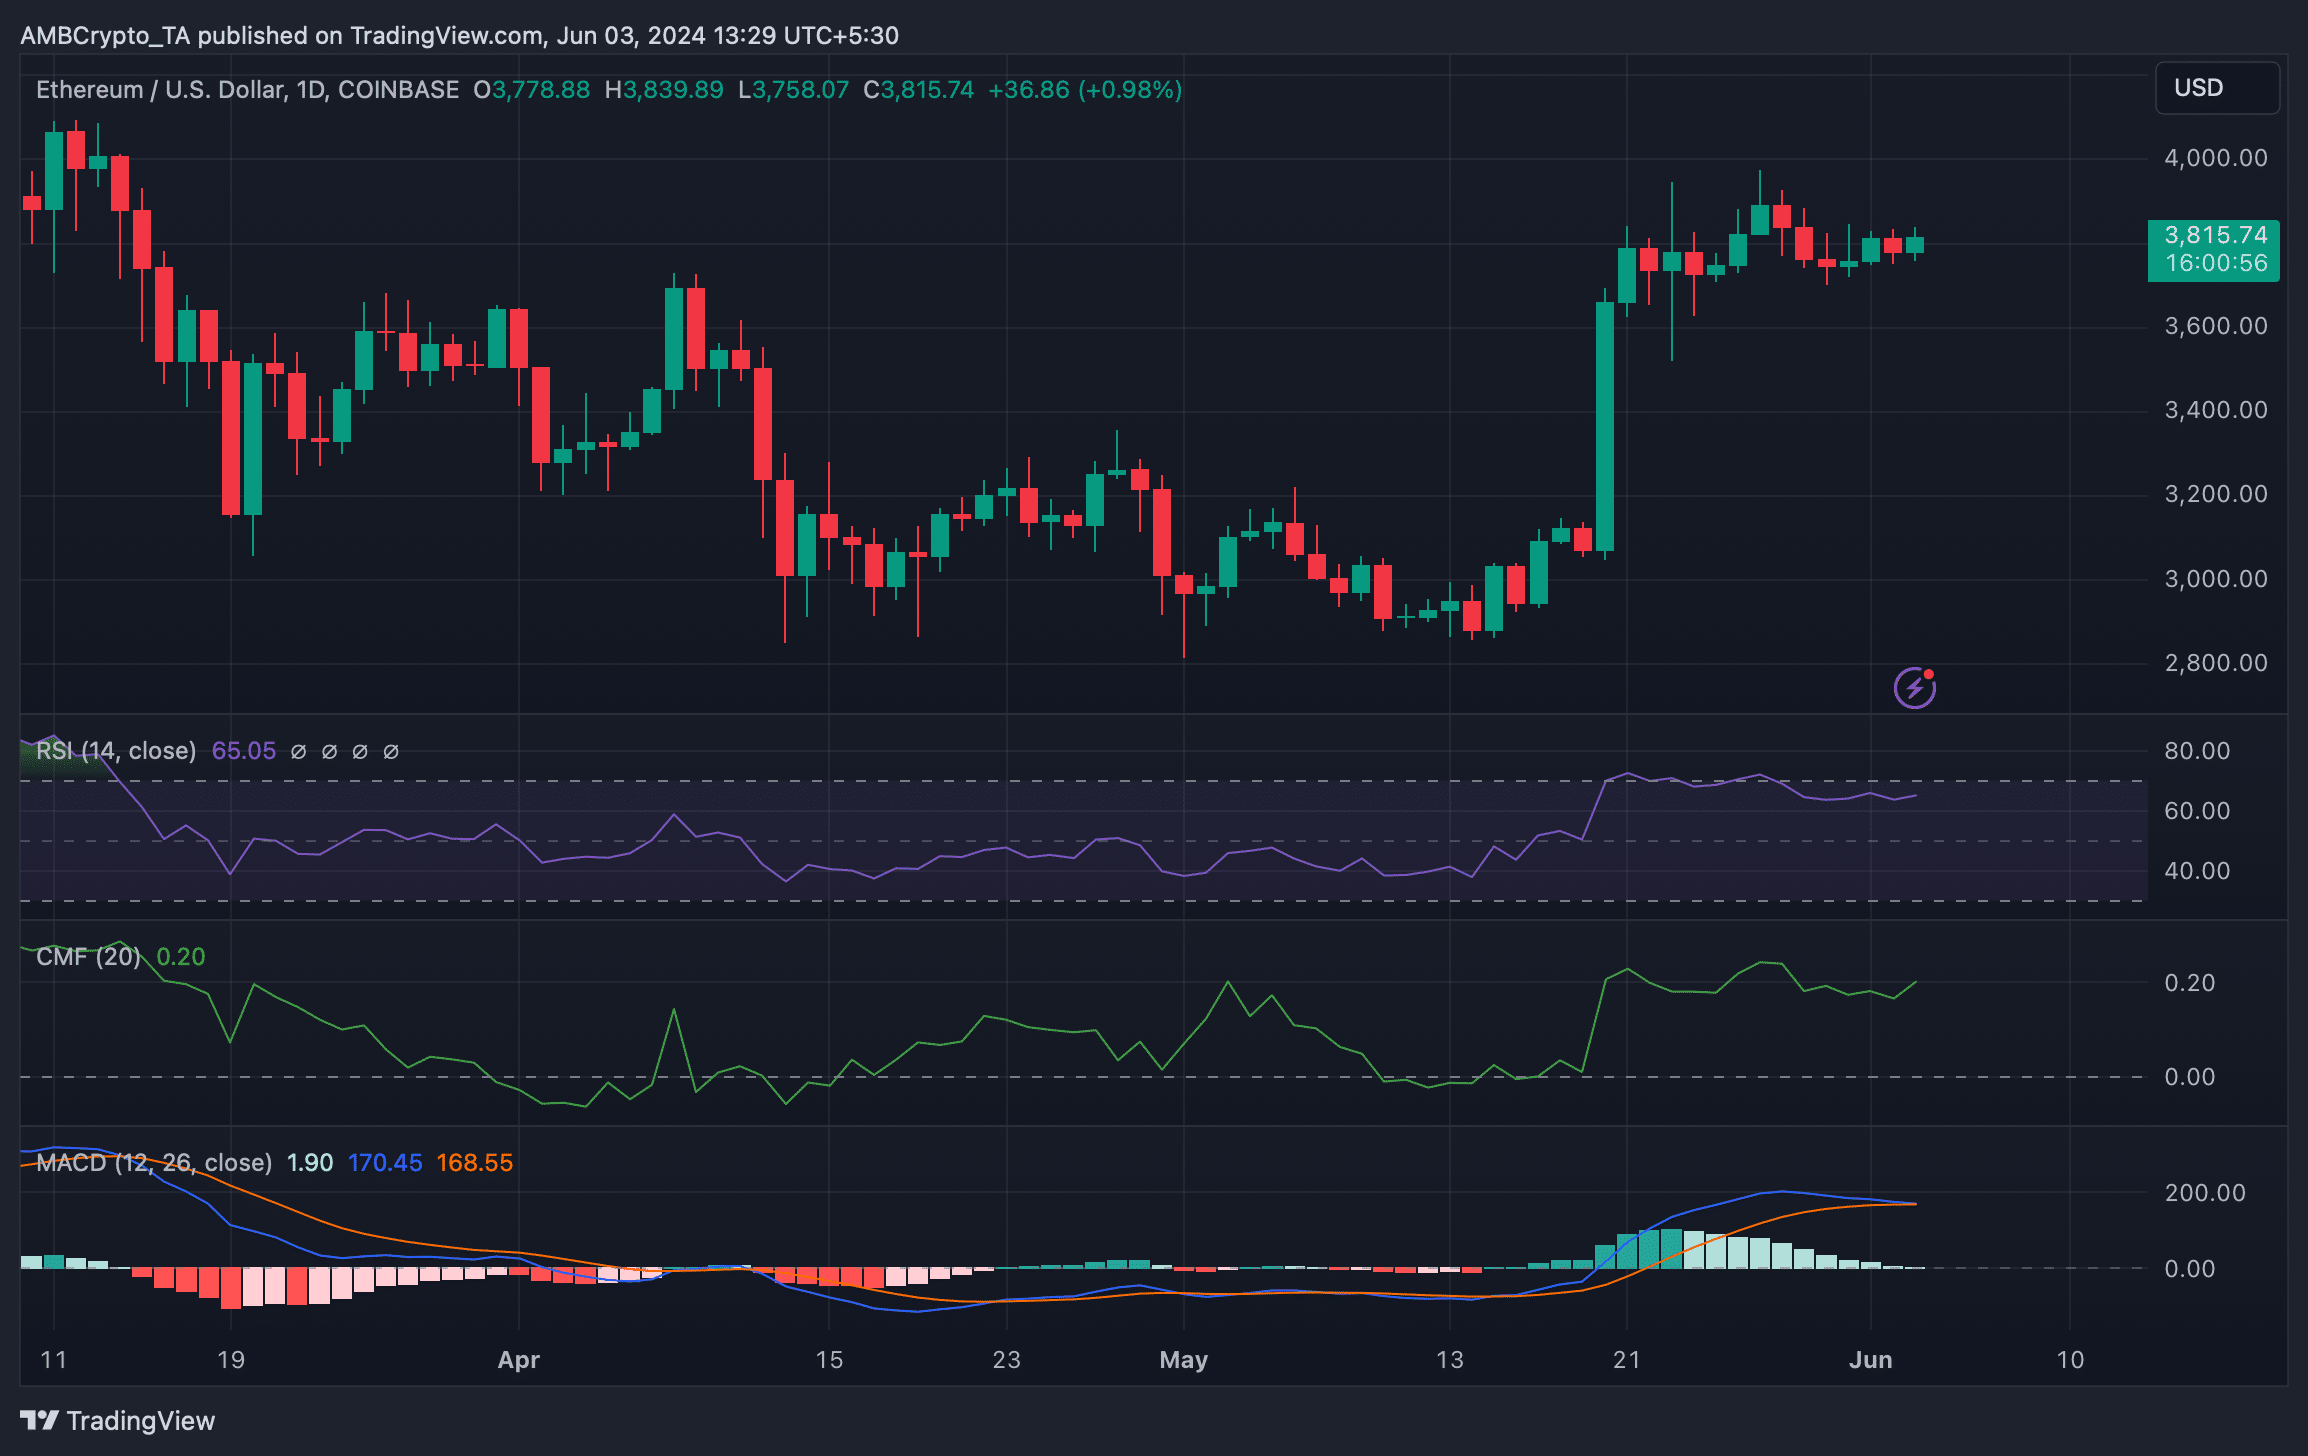
We then analyzed Ethereum’s daily chart to better understand which way it was headed. The technical indicator MACD displayed a bearish crossover, hinting at a price correction.
Read Ethereum’s [ETH] Price Prediction 2024-25
Nonetheless, the Chaikin Money Flow (CMF) had registered an uptick.
Moreover, the Relative Strength Index (RSI) also looked bullish, as it was well above the neutral mark. If these two indicators’ data is to be considered, then there are chances of a price increase.


