Ethereum whales dive into ETH at $3.7K – Will the market follow?

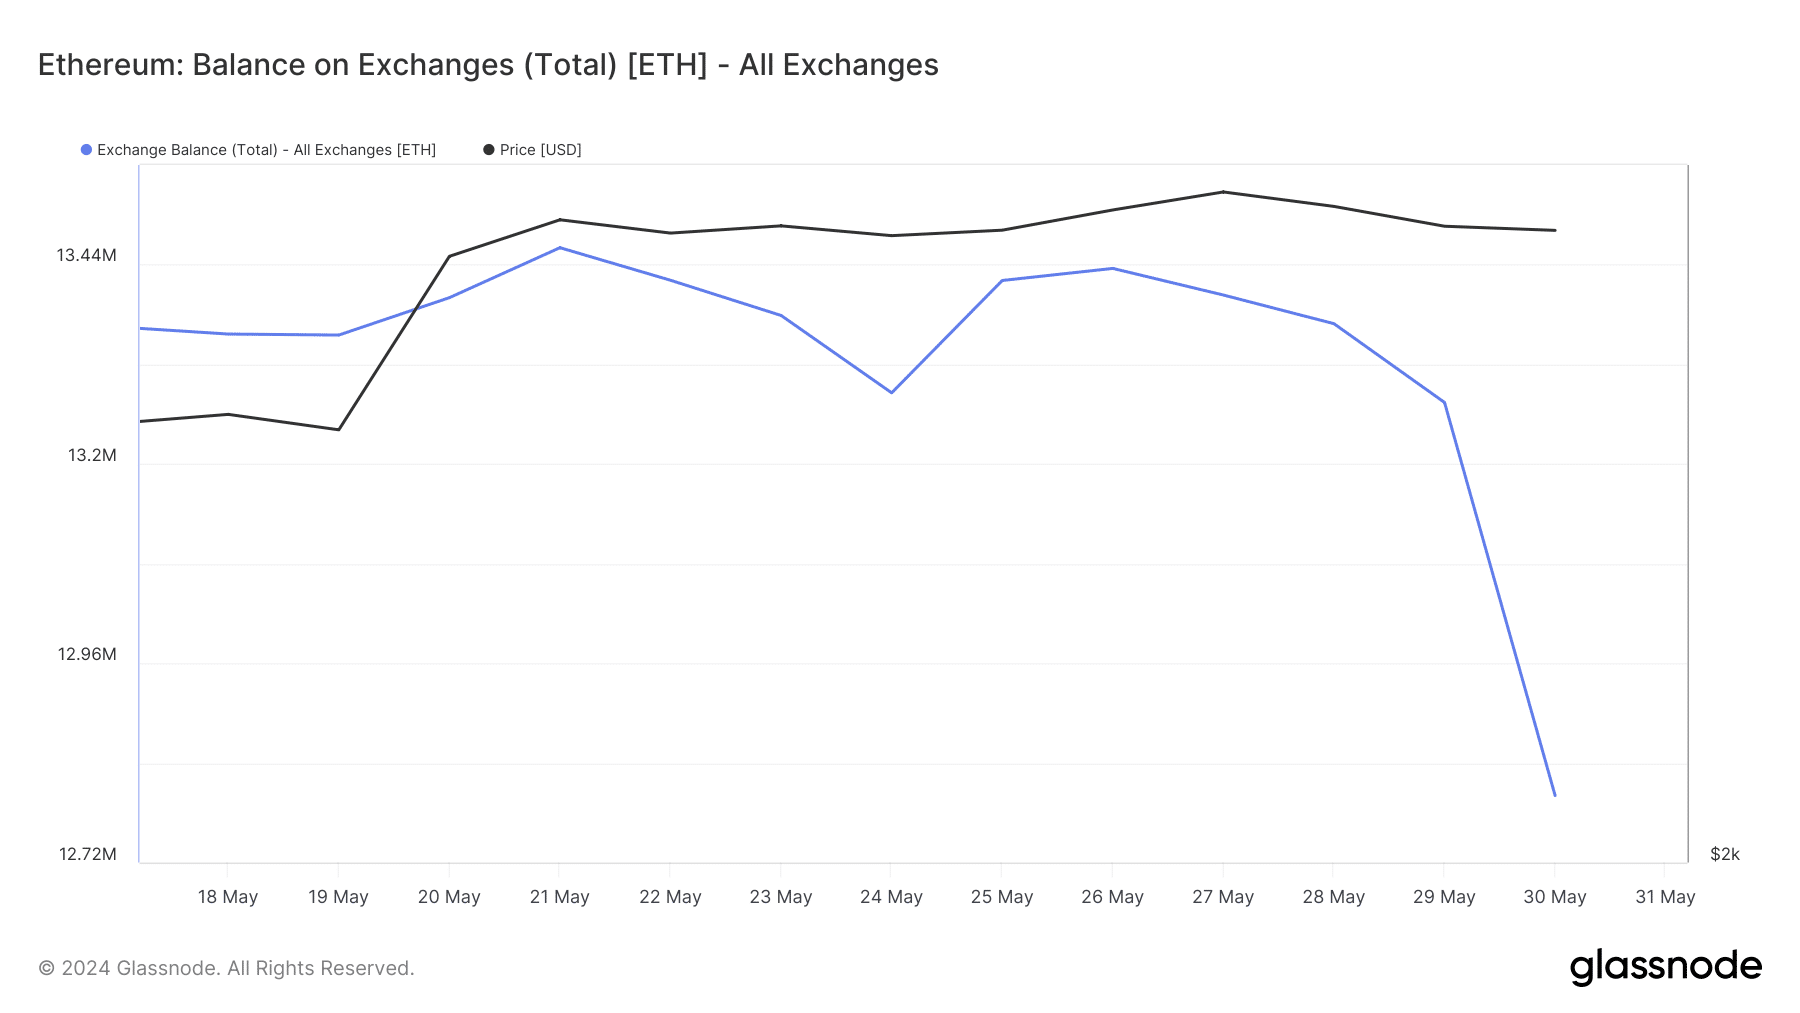
- Ethereum’s exchange reserve declined sharply on the 30th of May.
- Metrics suggested that ETH was in an overbought position.
Ethereum [ETH] enthusiasts got excited last week as the king of altcoins’ price once again exceeded $3.9k. However, ETH couldn’t hold its momentum and soon fell from that level. In the meantime, whales took the opportunity to stockpile more ETH.
Interest in Ethereum is growing
ETH had a rollercoaster ride last week as it managed to go above $3.9k on the 27th of May. But bears arrived soon as its value dropped.
It was interesting to note that the ETH ETF approval couldn’t propel substantial growth for the coin over the last week.
According to CoinMarketCap, ETH was down by over 1% in the last seven days. At the time of writing, the token was trading at $3,759.66 with a market capitalization of over $451 billion.
While the token’s price volatility remained high, whales made their move.
Ali, a popular crypto analyst, recently posted a tweet highlighting that there’s been a notable increase in Ethereum addresses holding more than 10,000 ETH.
This increase in the number of addresses suggested that whales were moving from a distribution phase to an accumulation phase.
AMBCrypto’s look at Glassnode’s data pointed out yet another metric that suggested a rise in accumulation. Ethereum’s balance on exchanges witnessed a major decline on the 30th of May, indicating high buying pressure.
The flip side of the story
Though the aforementioned data suggested that investors were buying ETH, AMBCrypto’s look at CryptoQuant’s data revealed a different story.
As per our analysis, Ethereum’s net deposit on exchanges was high compared to the last seven-day average, hinting at a rise in selling pressure.
On top of that, ETH’s Coinbase Premium was red. This clearly meant that selling sentiment was dominant among US investors.
A possible reason behind this could be ETH being overbought. Both ETH’s Relative Strength Index (RSI) and stochastic were in overbought positions.
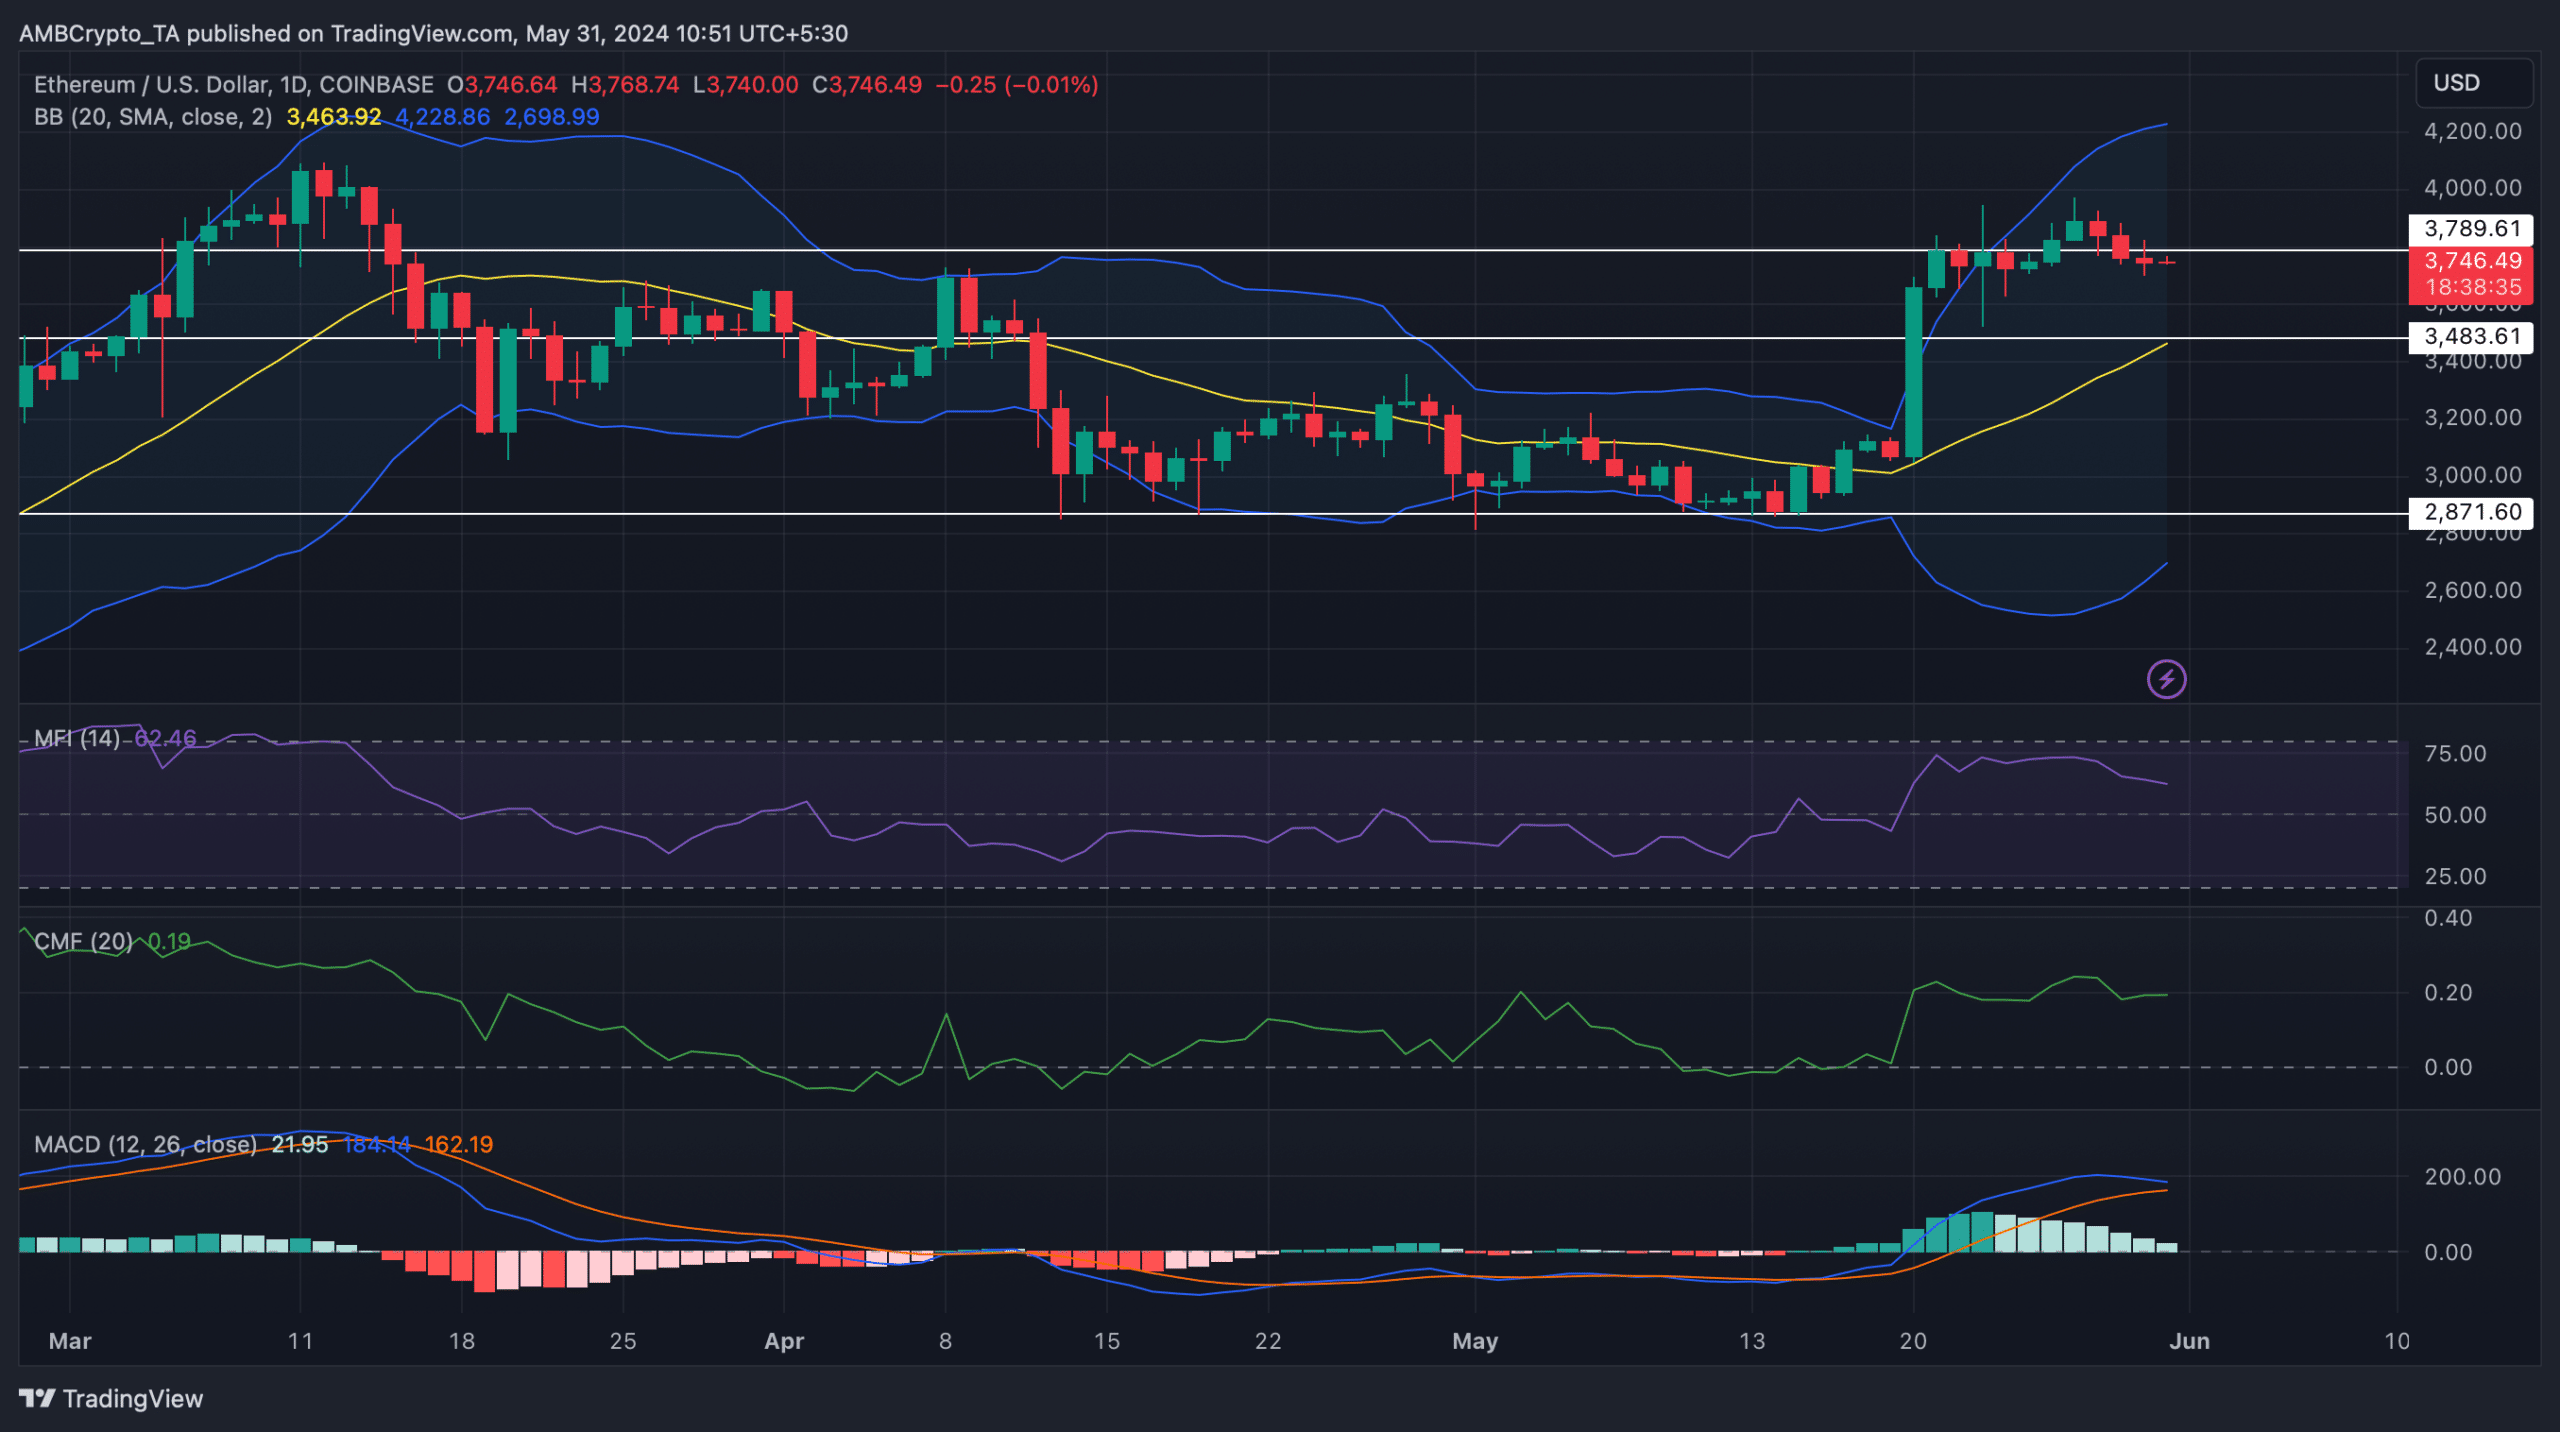
AMBCrypto then analyzed Ethereum’s daily chart to see how this change in buying and selling pressure might impact its price in the coming days.
The technical indicator MACD displayed the possibility of a bearish crossover. The Money Flow Index (MFI) registered a slight downtick.
As per Bollinger Bands, ETH’s price was in a highly volatile zone and was still resting well above its 20-day Simple Moving Average (SMA).
Is your portfolio green? Check the Ethereum Profit Calculator
Therefore, if the price decline continues, then ETH might first plummet to its 20-day SMA before rebounding.
Nonetheless, the Chaikin Money Flow (CMF) looked bullish as it went northward. This might allow ETH to break above its resistance at $3.789k sooner than expected.


