Ethereum’s 28% drop: What happens if ETH’s $2,850 support fails?

- ETH was trading at a significant support level.
- Key technical indicators hint at the possibility of a continued decline in ETH’s value.
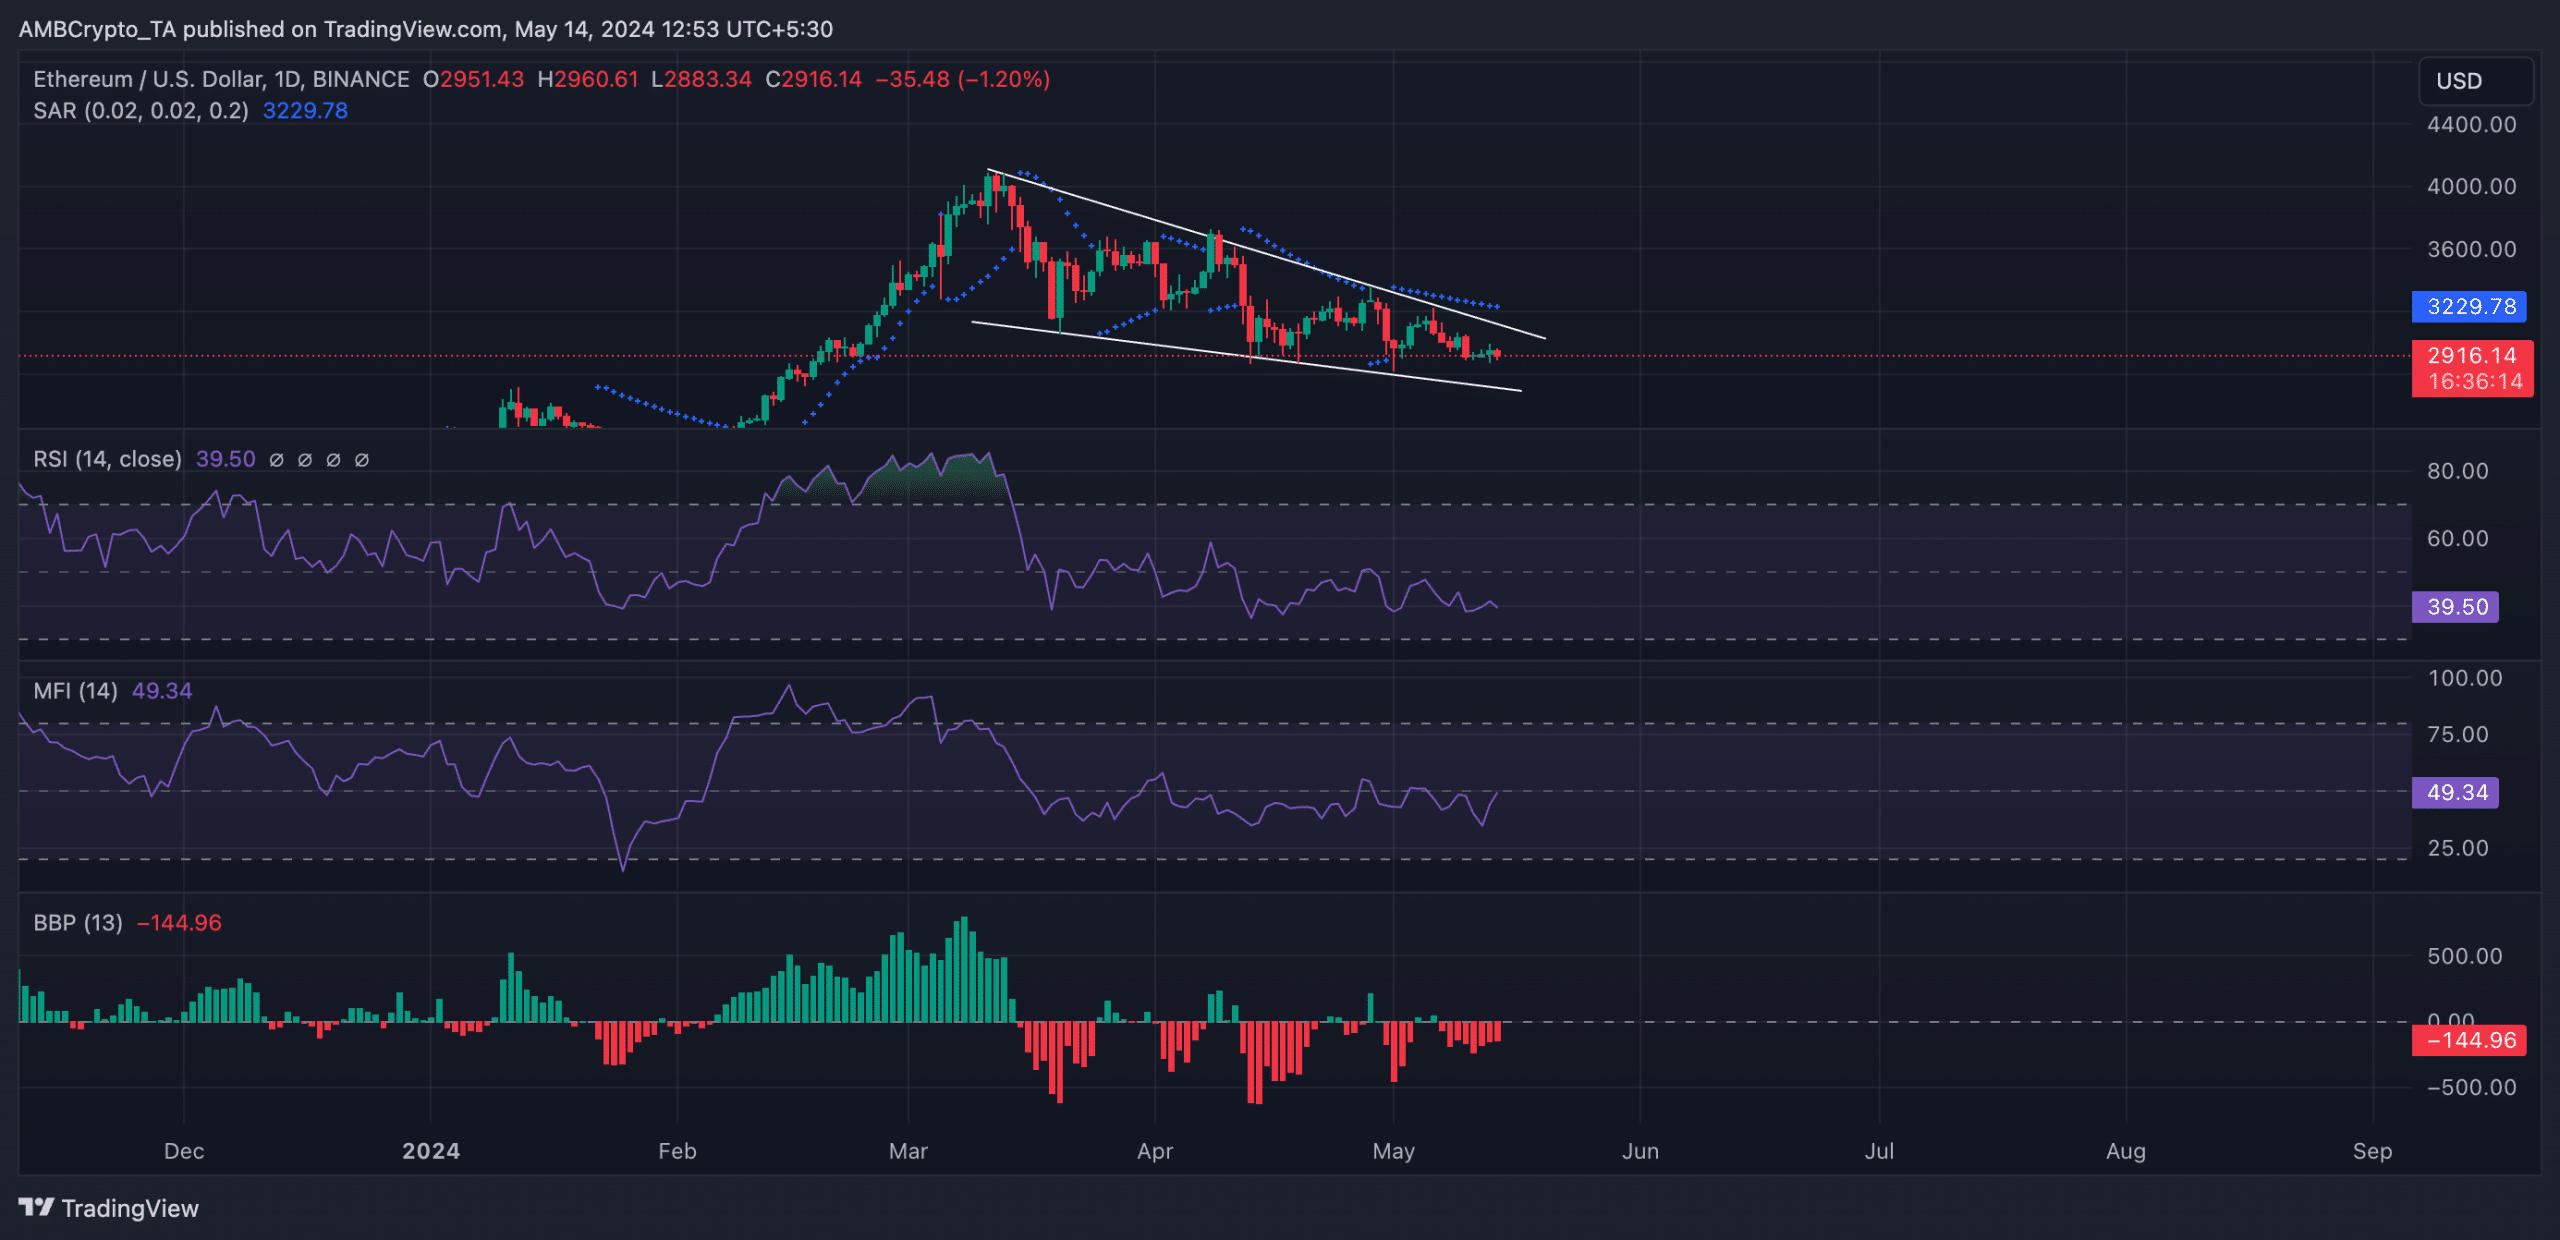
Leading altcoin Ethereum [ETH] is clinging to a crucial support level as its price trends within a descending channel.
A descending channel is formed when an asset’s price continues to make lower highs and lower lows, indicating a broader downward trend.
Readings from ETH’s price movements on a daily chart revealed the formation of this channel on 12 March. Since then, the coin’s value has declined by 28%.
According to CoinMarketCap’s data, the altcoin exchanged hands at $2915 as of this writing.
A break below or a break above?
If ETH bulls fail to defend the coin’s current support level of $2,850, its price might initiate a decline below the lower trendline of the descending channel.
If this happens, the altcoin will exchange hands at the $2600 level.
AMBCrypto’s assessments of some key technical indicators hinted at the possibility of a break below the current support level.
For example, ETH’s key momentum indicators signaled that the coin’s sell-offs outpaced its accumulation among market participants.
The coin’s Relative Strength Index (RSI) and Money Flow Index (MFI) were positioned below their respective neutral spots at press time. ETH’s RSI was 39.52, while its MFI was 49.39.
ETH’s Elder-Ray Index returned a negative value, confirming the current bearish trend. This indicator measures the relationship between the strength of buyers and sellers in the market.
When it returns a negative value, it means that bear power is dominant in the market.
Likewise, the dots that make up ETH’s Parabolic SAR were spotted above its price at press time. These dots have been so positioned since the beginning of May.
The Parabolic SAR indicator is used to identify potential trend direction and reversals. When its dotted lines are placed above an asset’s price, the market is said to be in a decline.
Read Ethereum’s [ETH] Price Prediction 2024-25
It indicates that the asset’s price has been falling and may continue.
Should ETH bears force a break below the current support level, the coin’s next price point might be $2780. However, if this projection is invalidated, the altcoin might rally above $3000.


