Why did Ethereum dive below $3K? Decoding ETH’s sudden 6% fall

- Ethereum has dropped below the $3,000 price range.
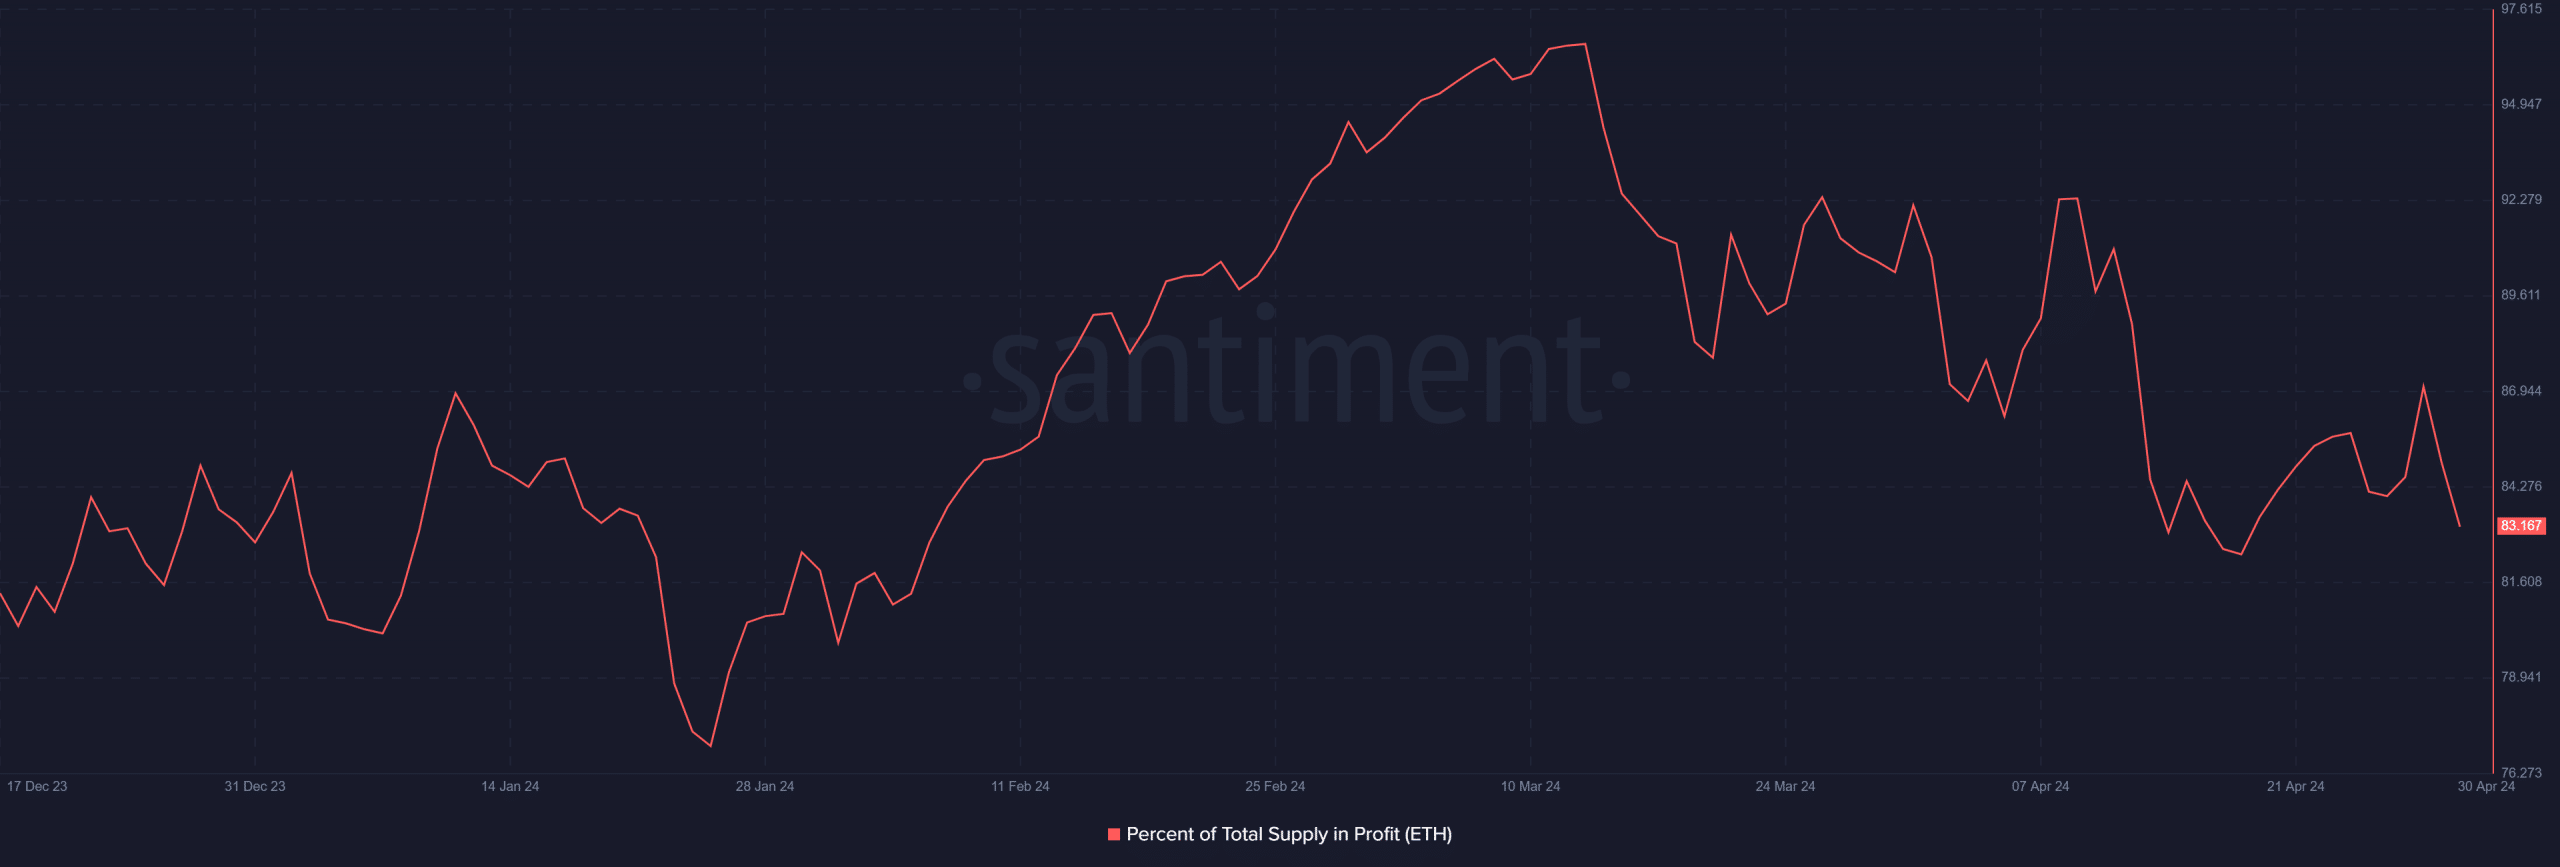
- ETH supply in profit dropped by around five million.
The Ethereum [ETH] market witnessed a substantial price downturn as trading activity concluded on the 30th of April. This decline had notable repercussions on several key metrics associated with the asset.
Ethereum falls 6%
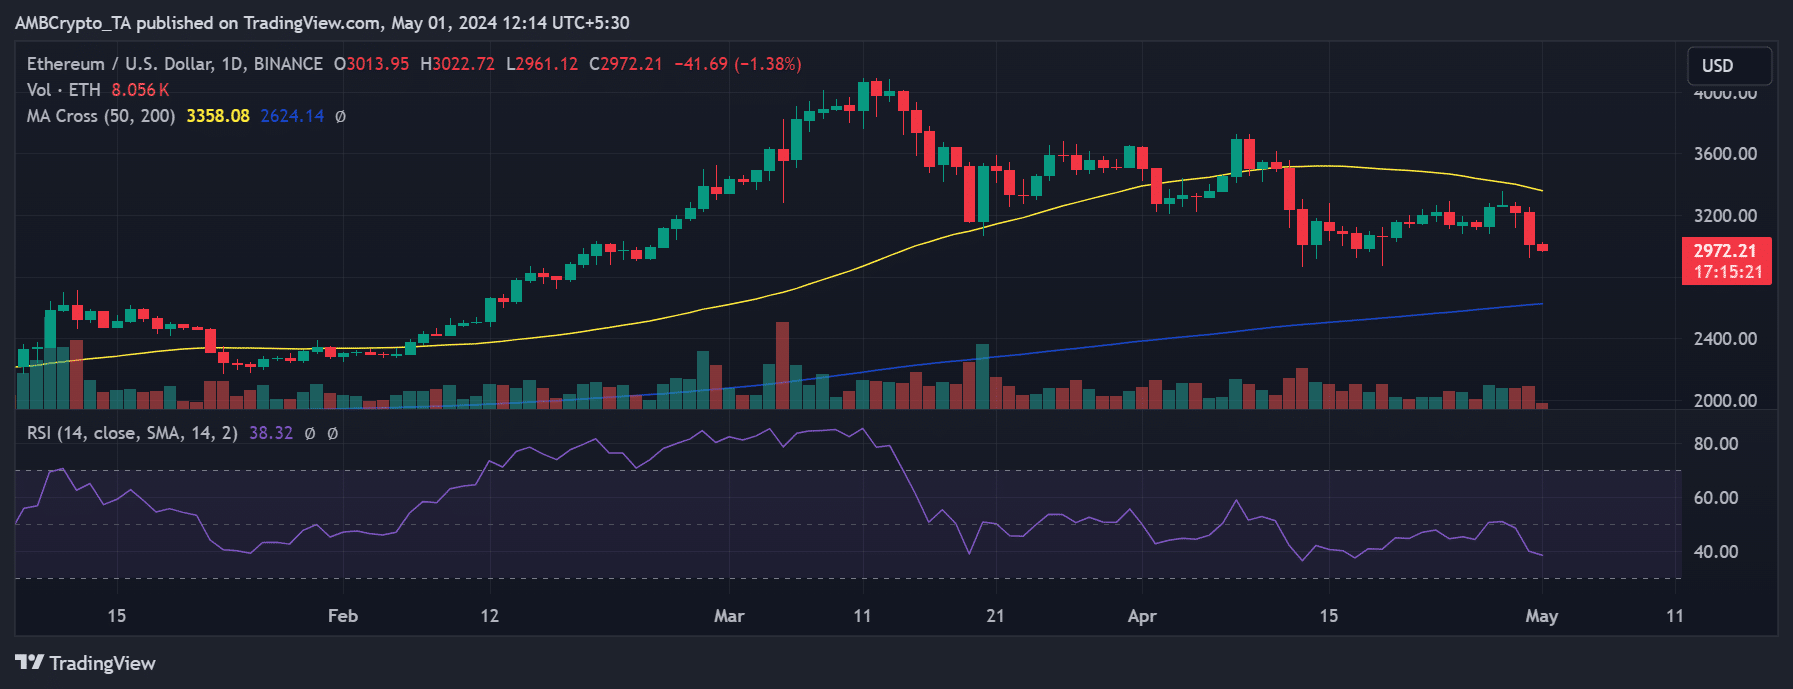
AMBCrypto’s analysis of Ethereum revealed a negative conclusion to April, marked by a significant price drop.
On the 30th of April, ETH experienced a decline of 6.29%, trading at approximately $3,013, just managing to hold onto the $3,000 price level.
However, as of the latest update, the decline persisted, pushing Ethereum below the $3,000 threshold. Its price was around $2,972 at press time.
Initially, Ethereum seemed poised to breach its short-term moving average (yellow line), which acted as resistance in the $3,300 to $3,500 range.
However, the recent downturn has pushed it further away from this target, and forced Ethereum to cross another significant threshold on its Relative Strength Index (RSI).
At press time, ETH dipped below 40 on the RSI, signaling a strong bearish trend.
Longs feel the heat of the dip
AMBCrypto’s analysis of Ethereum’s liquidation chart on Coinglass revealed a notable surge in liquidation volume on the 30th of April.
The king of altcoins witnessed its highest liquidation volume in weeks, totaling over $115 million by the end of trading that day.
Further examination of the chart highlighted that long positions bore the brunt of the liquidation, accounting for approximately $97.4 million. In comparison, short positions contributed $18.11 million to the total.
This spike in long liquidation marked the most significant volume seen in weeks, signifying that traders who had taken long positions or anticipated an increase in Ethereum’s price had their positions forcibly closed.
Possible reasons for the Ethereum decline
There has been discussion surrounding the Hong Kong ETFs launched on the 30th of April, with some observers expressing disappointment in their performance, citing low volume.
Figures indicated a total volume of around $12.7 million, with Bitcoin comprising over $9.7 million and Ethereum over $3 million.
However, contrasting views suggest that the volume was decent and not a failure, as suggested by other observers. The sluggish start contributed to the negative movement in Ethereum’s price.
Additionally, concerns about the Federal Reserve potentially maintaining its hawkish stance at the Federal Open Market Committee meeting on the 1st of May may have fueled the decline.
With no expectations of a rate cut due to persistent inflation in the US economy, the crypto market has historically exhibited declines leading up to FOMC meetings as investors exercise caution in anticipation of policy shifts.
Is your portfolio green? Check out the ETH Profit Calculator
Ethereum supply in profit declines
Ethereum’s supply in profit revealed a sharp decline. Per AMBCrypto’s analysis via Santiment, between the 28th and the 30th of April, ETH’s supply in profit dropped from over 87% to approximately 83%.
This shift indicated a decrease in volume from over 119 million to around 114 million ETH. It suggested that more holders were increasingly retaining their ETH assets at a loss as the price continued to decline.


