Bitcoin ‘volatility to emerge soon:’ Should you believe this key indicator?

- BTC’s key on-chain metric hinted at price volatility.
- However, technical indicators on a price chart refuted that claim.
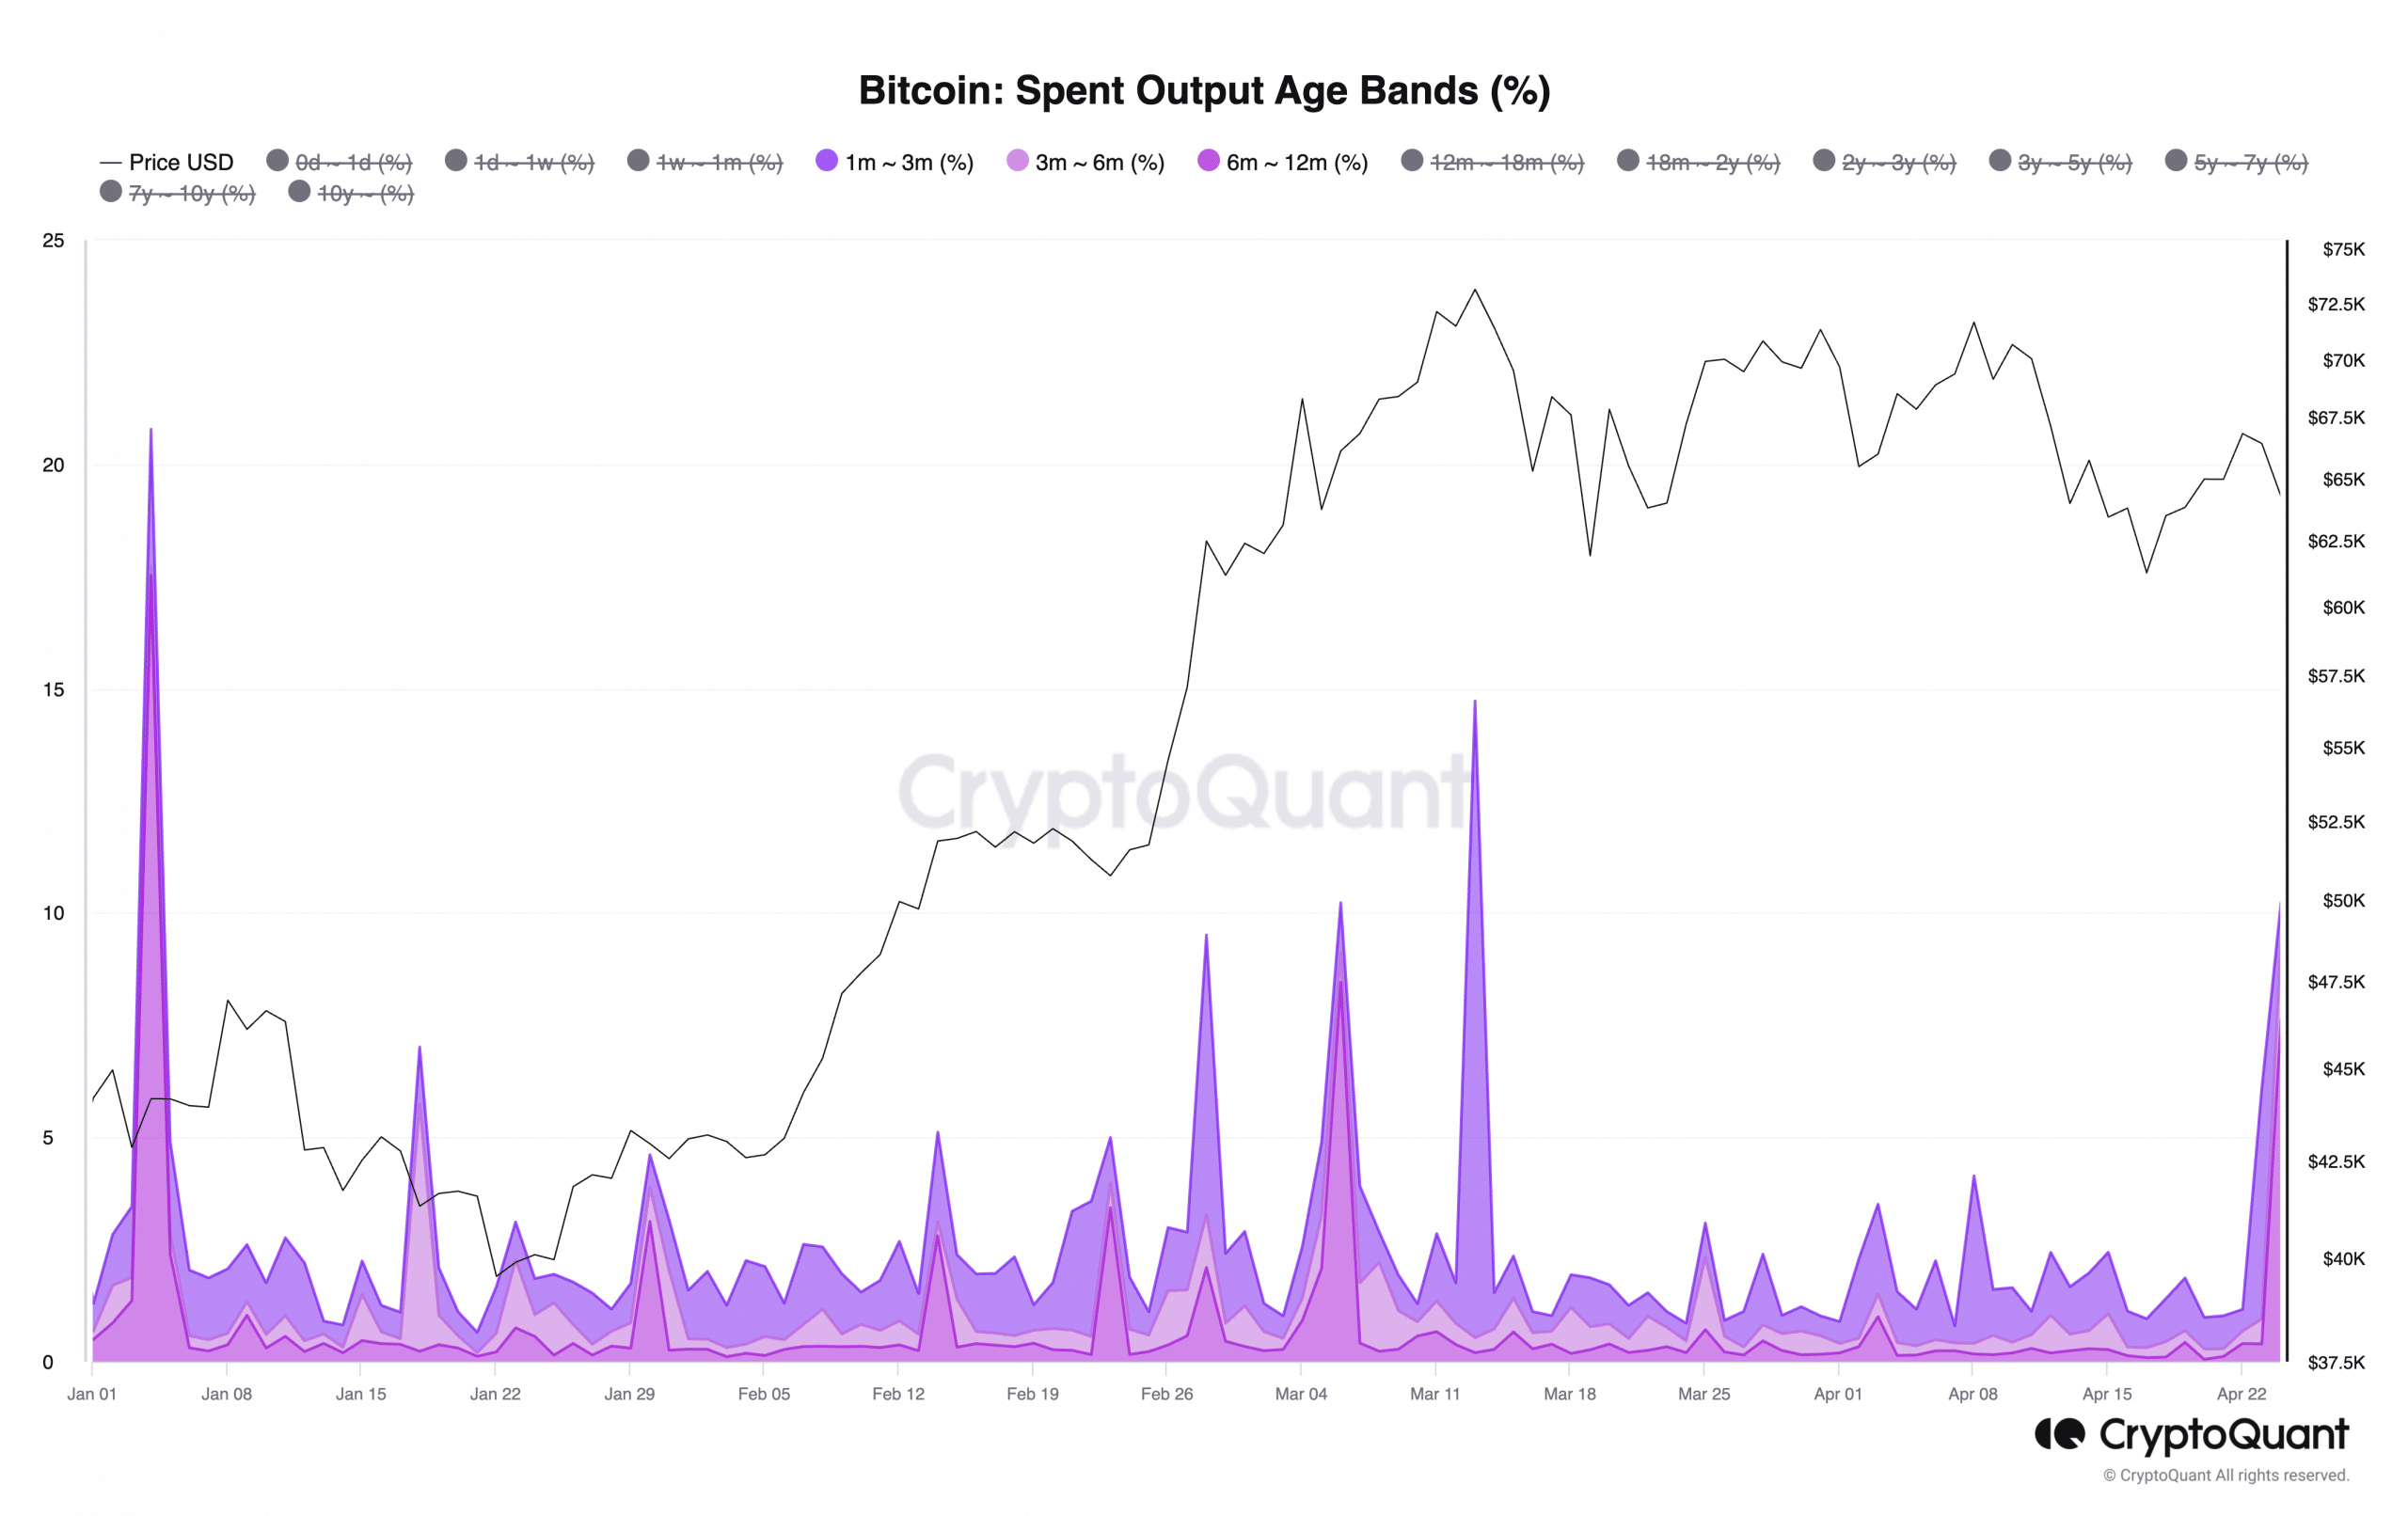
Bitcoin’s [BTC] spent outputs for investors that have held their coins for one to twelve months have witnessed a spike, hinting at the possibility of a price swing, according to CryptoQuant’s data.
BTC’s spent outputs for different age bands of investors offer insights into coin holders’ spending behavior.
For example, it can track whether coins held by short-term holders are being moved, indicating an uptick in profit-taking activity.
Volatility in the BTC market?
When the amount of spent output for short-term BTC holders increases, it often suggests a rally in market volatility.
In a recent report, pseudonymous CryptoQuant analyst Mignolet said,
“Movement of this entity can be seen as data for volatility confirmation rather than for price increases or decreases. It appears that volatility is likely to emerge soon.”
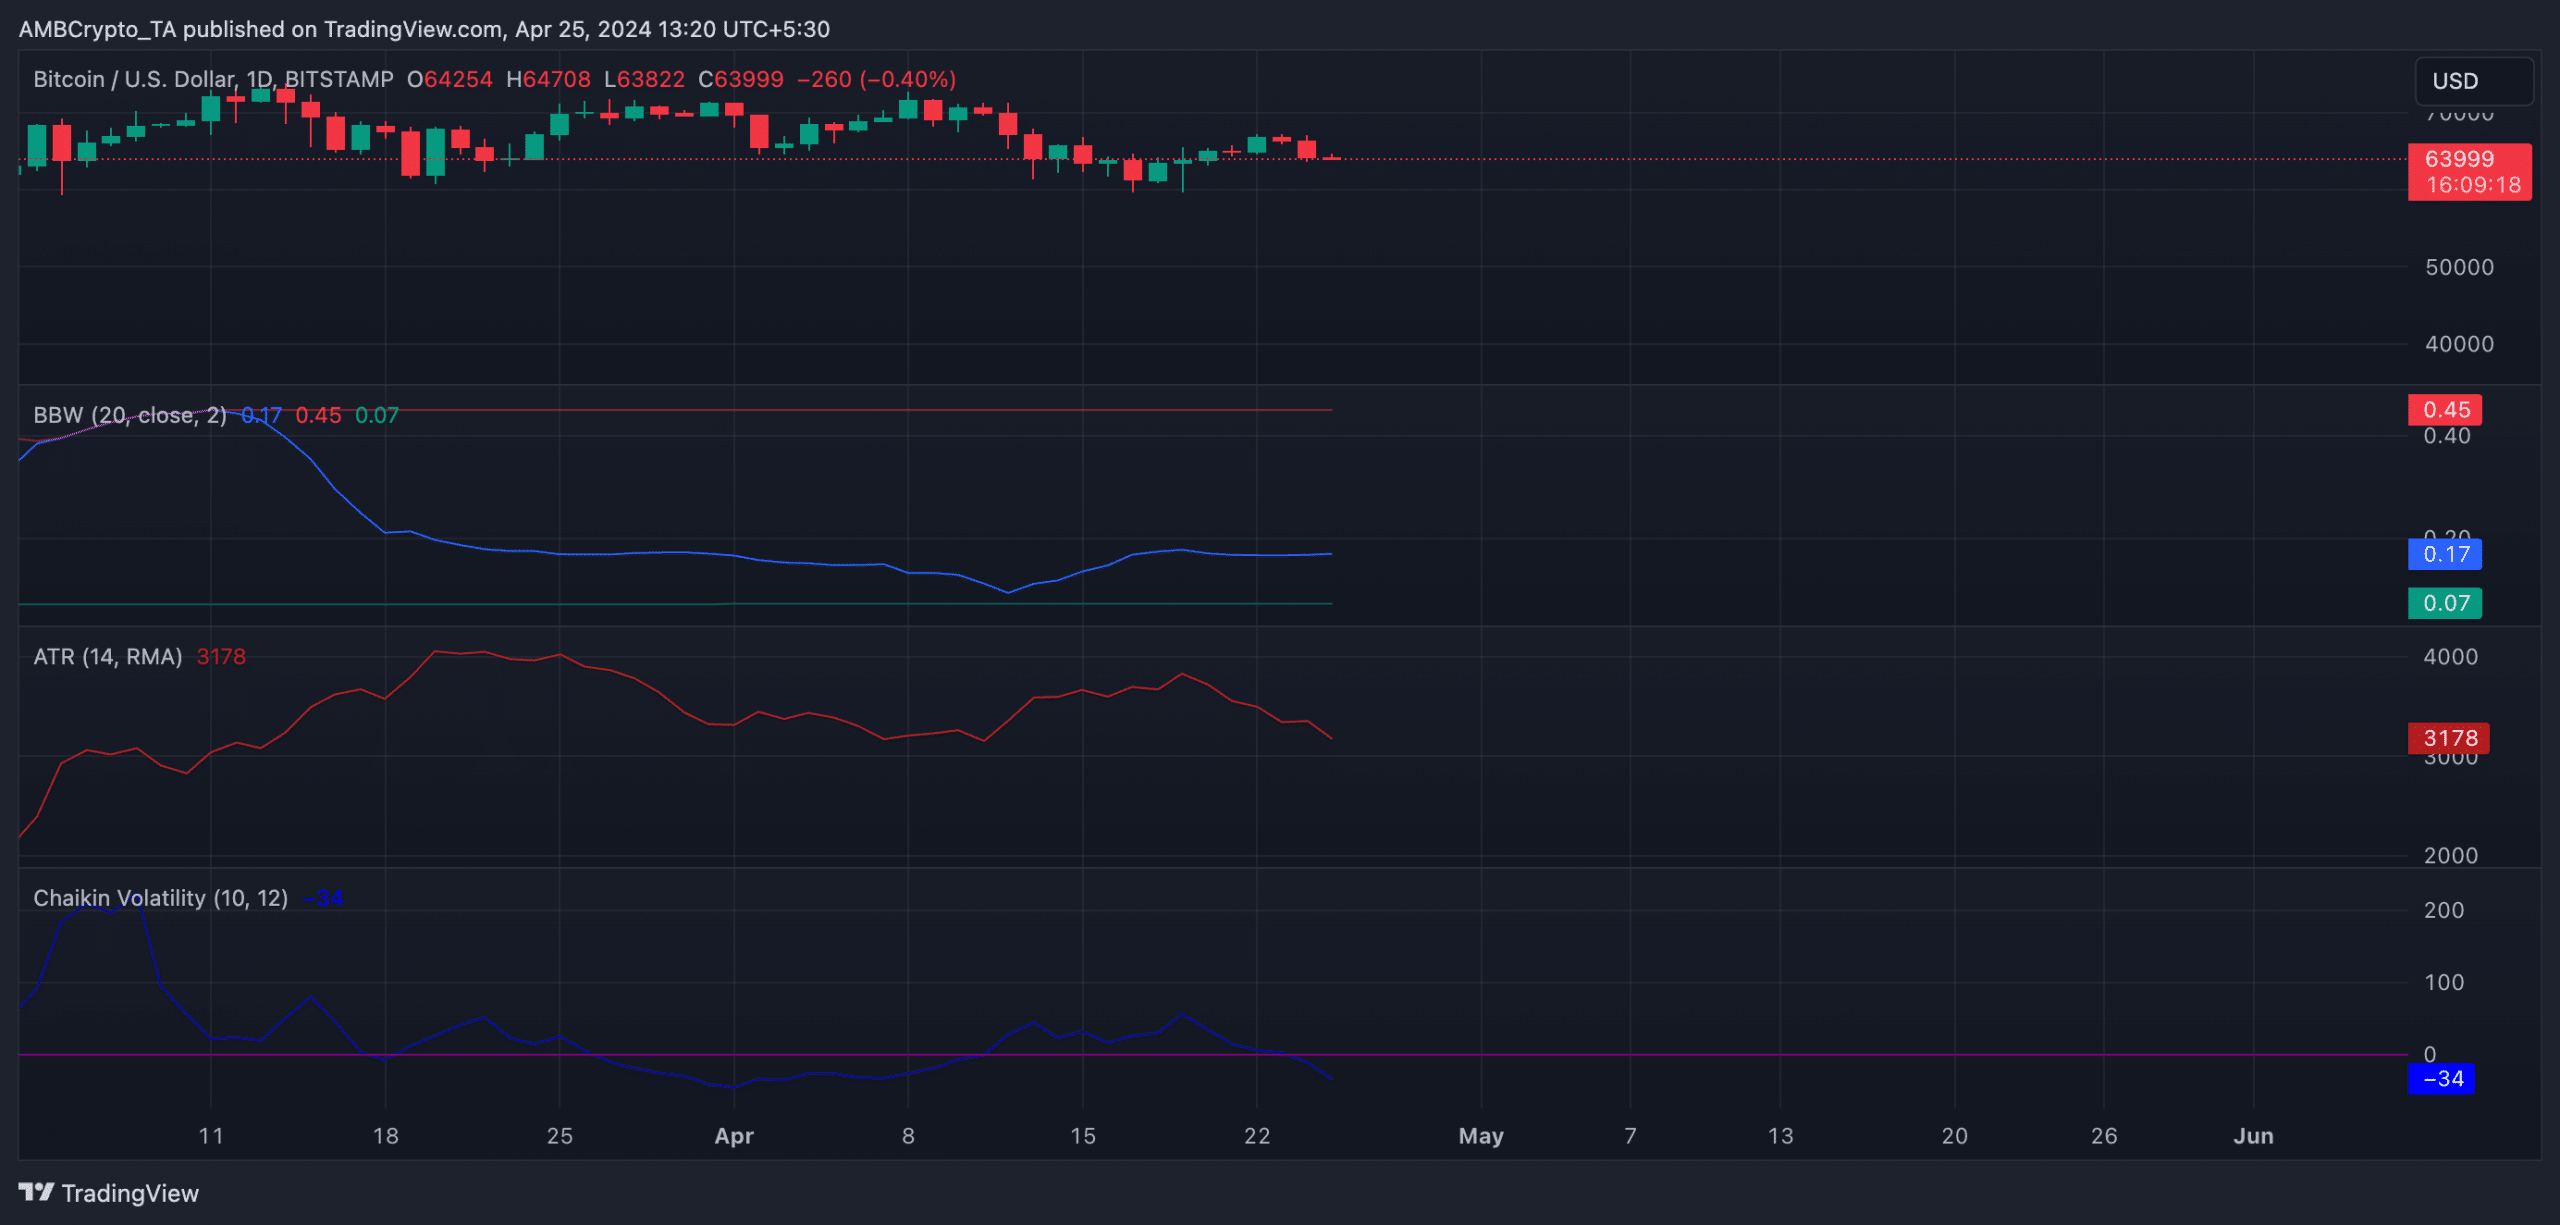
However, an assessment of the coin’s key volatility markers on a daily chart suggested minimal risk of any significant short-term price swings.
Readings from the BTC’s Average True Range (ATR) showed that it has steadily declined since the 19th of April.
This indicator measures the average range of price movements over a specified period. When it falls, it indicates a reduction in market volatility.
Confirming the decline in market volatility, BTC’s Chaikin Volatility was spotted in a downtrend at press time. Since the 19th of April, the value of the indicator has dropped by 162%.
This indicator measures an asset’s price volatility by comparing the current range between the high and low prices to a previous range over a specific period of time.
When it declines this way, it suggests that an asset’s market is becoming less volatile because the range between its high and low prices is contracting.
Further, BTC’s flat Bollinger Bandwidth (BBW) lent credence to the low volatility in the coin’s market.
Read Bitcoin [BTC] price prediction 2024 -2025
When an asset witnesses a flat BBW, it suggests that its price is experiencing low volatility and its movements are relatively stable and confined to a narrow range.
At press time, the leading crypto asset exchanged hands at $64,241. According to CoinMarketCap’s data, its value has climbed by 5% in the past seven days.


